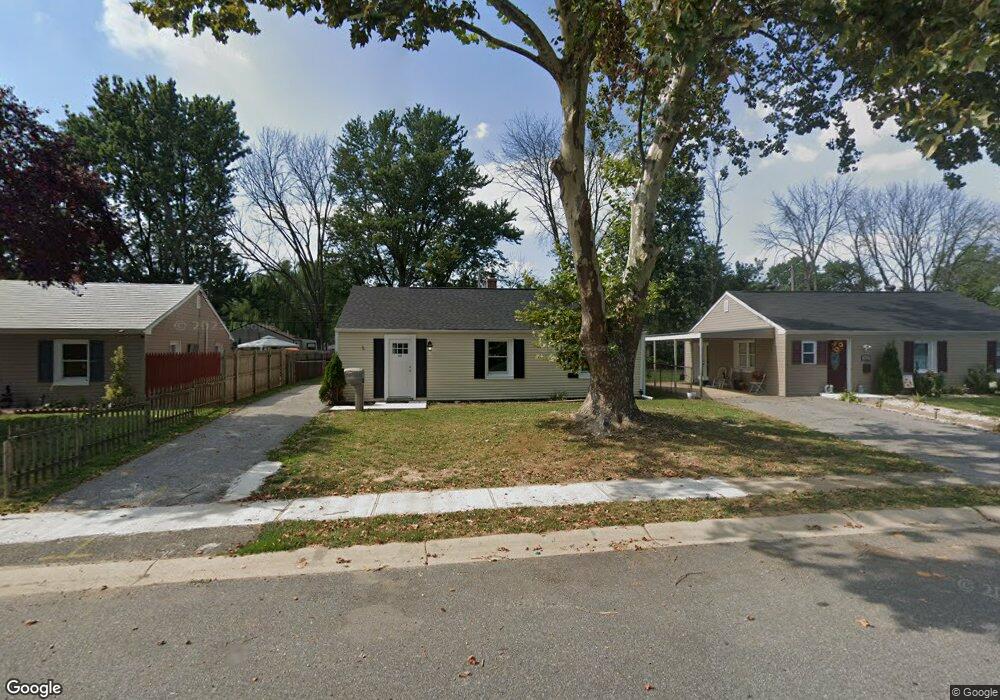
425 Howell Dr New Castle, DE 19720
Estimated Value: $118,000 - $267,220
3
Beds
1
Bath
1,188
Sq Ft
$182/Sq Ft
Est. Value
About This Home
This home is located at 425 Howell Dr, New Castle, DE 19720 and is currently estimated at $216,055, approximately $181 per square foot. 425 Howell Dr is a home located in New Castle County with nearby schools including New Castle Elementary School, Calvin R. McCullough Middle School, and Charter School of New Castle.
Ownership History
Date
Name
Owned For
Owner Type
Purchase Details
Closed on
May 31, 2023
Sold by
Carlson Phillip B
Bought by
Loyal Boh Creeks Llc
Current Estimated Value
Home Financials for this Owner
Home Financials are based on the most recent Mortgage that was taken out on this home.
Original Mortgage
$82,500
Outstanding Balance
$80,294
Interest Rate
6.39%
Mortgage Type
New Conventional
Estimated Equity
$135,761
Purchase Details
Closed on
Nov 3, 1992
Bought by
Carlson Phillip B and Jo Ann
Create a Home Valuation Report for This Property
The Home Valuation Report is an in-depth analysis detailing your home's value as well as a comparison with similar homes in the area
Home Values in the Area
Average Home Value in this Area
Purchase History
| Date | Buyer | Sale Price | Title Company |
|---|---|---|---|
| Loyal Boh Creeks Llc | $110,000 | None Listed On Document | |
| Carlson Phillip B | -- | -- |
Source: Public Records
Mortgage History
| Date | Status | Borrower | Loan Amount |
|---|---|---|---|
| Open | Loyal Boh Creeks Llc | $82,500 |
Source: Public Records
Tax History Compared to Growth
Tax History
| Year | Tax Paid | Tax Assessment Tax Assessment Total Assessment is a certain percentage of the fair market value that is determined by local assessors to be the total taxable value of land and additions on the property. | Land | Improvement |
|---|---|---|---|---|
| 2024 | $972 | $28,300 | $5,900 | $22,400 |
| 2023 | $883 | $28,300 | $5,900 | $22,400 |
| 2022 | $920 | $28,300 | $5,900 | $22,400 |
| 2021 | $920 | $28,300 | $5,900 | $22,400 |
| 2020 | $925 | $28,300 | $5,900 | $22,400 |
| 2019 | $1,668 | $28,300 | $5,900 | $22,400 |
| 2018 | $907 | $28,300 | $5,900 | $22,400 |
| 2017 | $849 | $28,300 | $5,900 | $22,400 |
| 2016 | $759 | $28,300 | $5,900 | $22,400 |
| 2015 | $759 | $28,300 | $5,900 | $22,400 |
| 2014 | $760 | $28,300 | $5,900 | $22,400 |
Source: Public Records
Map
Nearby Homes