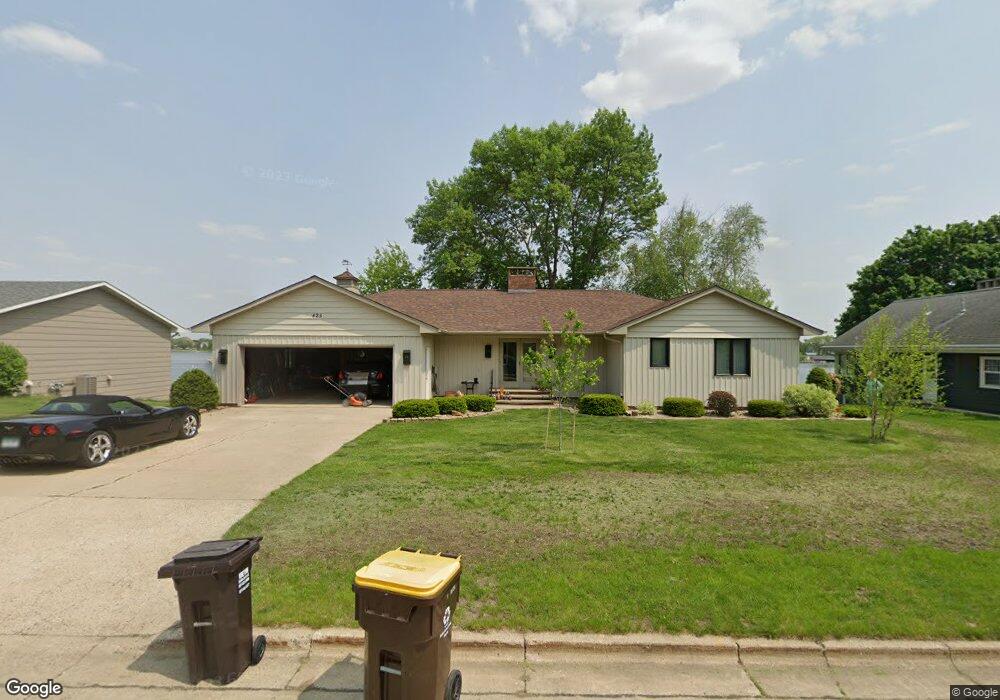
425 Kings Rd Fairmont, MN 56031
Estimated Value: $550,816 - $640,000
3
Beds
3
Baths
12,908
Sq Ft
$46/Sq Ft
Est. Value
About This Home
This home is located at 425 Kings Rd, Fairmont, MN 56031 and is currently estimated at $595,204, approximately $46 per square foot. 425 Kings Rd is a home located in Martin County with nearby schools including Fairmont Elementary School, Fairmont Junior/Senior High School, and St. Paul Lutheran School.
Ownership History
Date
Name
Owned For
Owner Type
Purchase Details
Closed on
Aug 19, 2019
Sold by
Gould Scott A
Bought by
Moran Matthew F and Moran Anne L
Current Estimated Value
Home Financials for this Owner
Home Financials are based on the most recent Mortgage that was taken out on this home.
Original Mortgage
$329,000
Interest Rate
3.5%
Mortgage Type
New Conventional
Purchase Details
Closed on
May 20, 2019
Sold by
Gould Scott A
Bought by
Moran Matthew F and Moran Anne L
Purchase Details
Closed on
Apr 13, 2017
Sold by
Campe Joan L and Campe Leaonard A
Bought by
Gould Scott A
Home Financials for this Owner
Home Financials are based on the most recent Mortgage that was taken out on this home.
Original Mortgage
$290,000
Interest Rate
4.1%
Mortgage Type
Credit Line Revolving
Purchase Details
Closed on
May 12, 2011
Sold by
Campe Leonard A and Campe Joan L
Bought by
Campe Leonard A and Campe Joan L
Create a Home Valuation Report for This Property
The Home Valuation Report is an in-depth analysis detailing your home's value as well as a comparison with similar homes in the area
Home Values in the Area
Average Home Value in this Area
Purchase History
| Date | Buyer | Sale Price | Title Company |
|---|---|---|---|
| Moran Matthew F | $412,000 | Stewart Title Company | |
| Moran Matthew F | -- | None Available | |
| Gould Scott A | $363,500 | Jenkinson Abstract Co | |
| Campe Leonard A | -- | None Available | |
| Hillsley Shane Shane | $454,000 | -- |
Source: Public Records
Mortgage History
| Date | Status | Borrower | Loan Amount |
|---|---|---|---|
| Previous Owner | Moran Matthew F | $329,000 | |
| Previous Owner | Gould Scott A | $290,000 |
Source: Public Records
Tax History Compared to Growth
Tax History
| Year | Tax Paid | Tax Assessment Tax Assessment Total Assessment is a certain percentage of the fair market value that is determined by local assessors to be the total taxable value of land and additions on the property. | Land | Improvement |
|---|---|---|---|---|
| 2025 | $7,270 | $546,400 | $137,200 | $409,200 |
| 2024 | $7,548 | $528,500 | $178,400 | $350,100 |
| 2023 | $6,898 | $574,000 | $165,600 | $408,400 |
| 2022 | $6,830 | $500,200 | $83,600 | $416,600 |
| 2021 | $5,528 | $463,000 | $83,600 | $379,400 |
| 2020 | $5,286 | $389,400 | $83,600 | $305,800 |
| 2019 | $5,108 | $363,100 | $83,600 | $279,500 |
| 2018 | $5,352 | $363,100 | $83,600 | $279,500 |
| 2017 | $4,750 | $344,700 | $82,240 | $262,460 |
| 2016 | $4,538 | $342,800 | $78,253 | $264,547 |
| 2015 | $4,037 | $337,700 | $78,142 | $259,558 |
| 2013 | $4,147 | $297,700 | $77,113 | $220,587 |
Source: Public Records
Map
Nearby Homes
- 501 S Fairlakes Ave
- 411 Albion Ave
- 209 S Main St
- 767 Shoreacres Dr
- 123 Linden Ave
- 302 Victoria St
- 227 S Elm St
- 841 Redwood Dr
- 231 S Prairie Ave
- 418 Forest St
- 431 Webster St
- 847 S Hampton St
- 944 S Hampton St
- 1334 Oak Beach Dr
- 1317 Beach Place
- 915 S Hampton St
- 603 Webster St
- 1365 Oak Beach Dr
- 223 W 10th St
- 525 N Hampton St