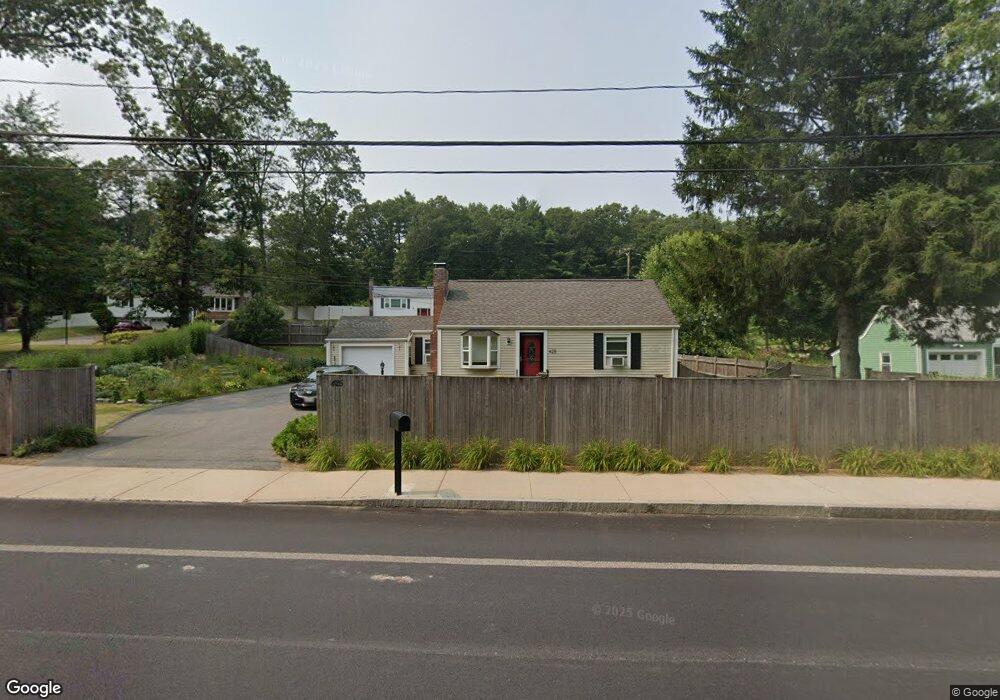
425 Main St Millis, MA 02054
Estimated Value: $352,000 - $534,000
2
Beds
1
Bath
776
Sq Ft
$576/Sq Ft
Est. Value
About This Home
This home is located at 425 Main St, Millis, MA 02054 and is currently estimated at $447,271, approximately $576 per square foot. 425 Main St is a home located in Norfolk County with nearby schools including Clyde F Brown, Millis Middle School, and Millis High School.
Ownership History
Date
Name
Owned For
Owner Type
Purchase Details
Closed on
Oct 1, 2009
Sold by
Boyle Michelle A
Bought by
Carter Jeffrey M and Carter Sara E
Current Estimated Value
Home Financials for this Owner
Home Financials are based on the most recent Mortgage that was taken out on this home.
Original Mortgage
$240,562
Outstanding Balance
$157,404
Interest Rate
5.12%
Mortgage Type
Purchase Money Mortgage
Estimated Equity
$289,867
Purchase Details
Closed on
Jun 25, 2004
Sold by
Rogerson Christy and Tierney Thomas M
Bought by
Boyle Michelle A
Home Financials for this Owner
Home Financials are based on the most recent Mortgage that was taken out on this home.
Original Mortgage
$207,920
Interest Rate
6.32%
Mortgage Type
Purchase Money Mortgage
Create a Home Valuation Report for This Property
The Home Valuation Report is an in-depth analysis detailing your home's value as well as a comparison with similar homes in the area
Home Values in the Area
Average Home Value in this Area
Purchase History
| Date | Buyer | Sale Price | Title Company |
|---|---|---|---|
| Carter Jeffrey M | $246,500 | -- | |
| Boyle Michelle A | $259,900 | -- |
Source: Public Records
Mortgage History
| Date | Status | Borrower | Loan Amount |
|---|---|---|---|
| Open | Carter Jeffrey M | $240,562 | |
| Previous Owner | Boyle Michelle A | $207,920 | |
| Previous Owner | Boyle Michelle A | $25,990 |
Source: Public Records
Tax History
| Year | Tax Paid | Tax Assessment Tax Assessment Total Assessment is a certain percentage of the fair market value that is determined by local assessors to be the total taxable value of land and additions on the property. | Land | Improvement |
|---|---|---|---|---|
| 2025 | $5,542 | $337,900 | $169,100 | $168,800 |
| 2024 | $5,461 | $332,600 | $169,100 | $163,500 |
| 2023 | $5,154 | $294,700 | $147,100 | $147,600 |
| 2022 | $5,385 | $285,200 | $147,100 | $138,100 |
| 2021 | $5,490 | $279,800 | $147,100 | $132,700 |
| 2020 | $5,166 | $256,500 | $137,400 | $119,100 |
| 2019 | $4,473 | $239,200 | $125,400 | $113,800 |
| 2018 | $4,105 | $227,800 | $114,000 | $113,800 |
| 2017 | $3,955 | $214,700 | $106,100 | $108,600 |
| 2016 | $3,744 | $214,700 | $106,100 | $108,600 |
| 2015 | $3,650 | $214,700 | $106,100 | $108,600 |
Source: Public Records
Map
Nearby Homes
Your Personal Tour Guide
Ask me questions while you tour the home.