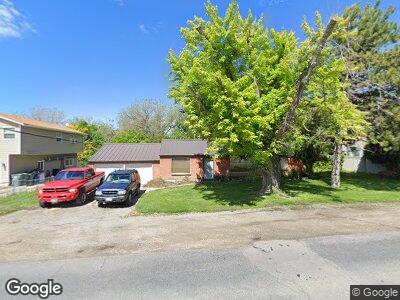
425 N 300 E Pleasant Grove, UT 84062
Estimated Value: $442,000 - $507,571
4
Beds
2
Baths
1,296
Sq Ft
$367/Sq Ft
Est. Value
About This Home
This home is located at 425 N 300 E, Pleasant Grove, UT 84062 and is currently estimated at $476,143, approximately $367 per square foot. 425 N 300 E is a home located in Utah County with nearby schools including Pleasant Grove Junior High School, Pleasant Grove High School, and John Hancock Charter School.
Ownership History
Date
Name
Owned For
Owner Type
Purchase Details
Closed on
Apr 13, 2012
Sold by
Degraffenried James E
Bought by
Hill Paul D and Hill Eshter B
Current Estimated Value
Purchase Details
Closed on
Oct 3, 2008
Sold by
Wiscombe Steven P and Wiscombe Sandra
Bought by
Swenson Kalob and Wiscombe Sommer
Home Financials for this Owner
Home Financials are based on the most recent Mortgage that was taken out on this home.
Original Mortgage
$154,912
Interest Rate
6.43%
Mortgage Type
FHA
Create a Home Valuation Report for This Property
The Home Valuation Report is an in-depth analysis detailing your home's value as well as a comparison with similar homes in the area
Home Values in the Area
Average Home Value in this Area
Purchase History
| Date | Buyer | Sale Price | Title Company |
|---|---|---|---|
| Hill Paul D | -- | Title West | |
| Swenson Kalob | -- | Greenbrier Title Insurance |
Source: Public Records
Mortgage History
| Date | Status | Borrower | Loan Amount |
|---|---|---|---|
| Open | Swenson Kalob | $230,000 | |
| Closed | Swenson Kalob | $148,400 | |
| Previous Owner | Degraffenried James E | $49,883 | |
| Previous Owner | Swenson Kalob | $154,912 | |
| Previous Owner | Degraffenried Phillip | $105,000 |
Source: Public Records
Tax History Compared to Growth
Tax History
| Year | Tax Paid | Tax Assessment Tax Assessment Total Assessment is a certain percentage of the fair market value that is determined by local assessors to be the total taxable value of land and additions on the property. | Land | Improvement |
|---|---|---|---|---|
| 2024 | $1,805 | $215,435 | $0 | $0 |
| 2023 | $1,753 | $214,115 | $0 | $0 |
| 2022 | $1,977 | $240,295 | $0 | $0 |
| 2021 | $1,702 | $315,100 | $171,400 | $143,700 |
| 2020 | $1,563 | $283,600 | $153,000 | $130,600 |
| 2019 | $1,355 | $254,200 | $140,600 | $113,600 |
| 2018 | $1,315 | $233,400 | $128,200 | $105,200 |
| 2017 | $1,181 | $111,540 | $0 | $0 |
| 2016 | $1,128 | $102,905 | $0 | $0 |
| 2015 | $1,166 | $100,705 | $0 | $0 |
| 2014 | $1,084 | $92,730 | $0 | $0 |
Source: Public Records
Map
Nearby Homes