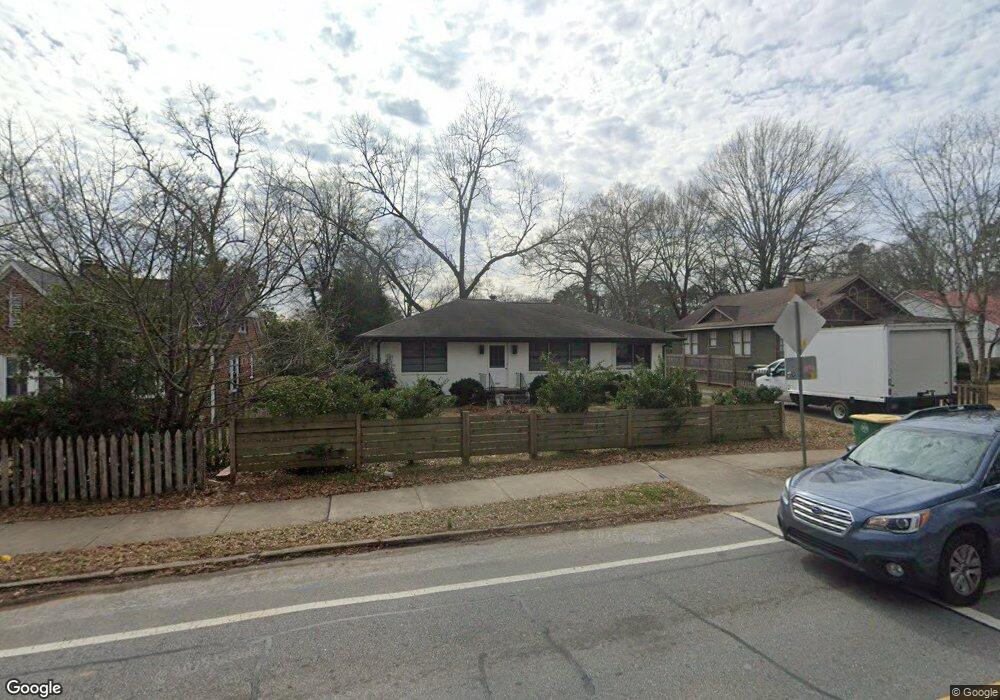
425 Oglethorpe Ave Athens, GA 30606
Normaltown NeighborhoodEstimated Value: $530,000 - $646,000
3
Beds
2
Baths
1,525
Sq Ft
$378/Sq Ft
Est. Value
About This Home
This home is located at 425 Oglethorpe Ave, Athens, GA 30606 and is currently estimated at $577,039, approximately $378 per square foot. 425 Oglethorpe Ave is a home located in Clarke County with nearby schools including Johnnie Lay Burks Elementary School, Clarke Middle School, and Clarke Central High School.
Ownership History
Date
Name
Owned For
Owner Type
Purchase Details
Closed on
Nov 1, 2016
Sold by
Milsted Renee
Bought by
Properties By Diana Llc
Current Estimated Value
Home Financials for this Owner
Home Financials are based on the most recent Mortgage that was taken out on this home.
Original Mortgage
$100,000
Outstanding Balance
$79,850
Interest Rate
3.42%
Mortgage Type
New Conventional
Estimated Equity
$497,189
Purchase Details
Closed on
Jul 21, 2015
Sold by
Marshall Frances T
Bought by
St James Methodist Church Of A
Purchase Details
Closed on
Jun 25, 2010
Sold by
Laflamme Marguerite A
Bought by
Hufford Kyle John
Purchase Details
Closed on
Oct 7, 2008
Sold by
Not Provided
Bought by
Hufford Kyle John
Purchase Details
Closed on
Aug 18, 2007
Sold by
Not Provided
Bought by
Hufford Kyle John
Create a Home Valuation Report for This Property
The Home Valuation Report is an in-depth analysis detailing your home's value as well as a comparison with similar homes in the area
Home Values in the Area
Average Home Value in this Area
Purchase History
| Date | Buyer | Sale Price | Title Company |
|---|---|---|---|
| Properties By Diana Llc | -- | -- | |
| Milsted Renee | $266,400 | -- | |
| St James Methodist Church Of A | -- | -- | |
| First American Bank & Trust | -- | -- | |
| Hufford Kyle John | -- | -- | |
| Hufford Kyle John | -- | -- | |
| Hufford Kyle John | -- | -- |
Source: Public Records
Mortgage History
| Date | Status | Borrower | Loan Amount |
|---|---|---|---|
| Open | Milsted Renee | $100,000 | |
| Closed | Properties By Diana Llc | $100,000 |
Source: Public Records
Tax History
| Year | Tax Paid | Tax Assessment Tax Assessment Total Assessment is a certain percentage of the fair market value that is determined by local assessors to be the total taxable value of land and additions on the property. | Land | Improvement |
|---|---|---|---|---|
| 2025 | $6,937 | $223,407 | $44,000 | $179,407 |
| 2024 | $6,937 | $208,242 | $44,000 | $164,242 |
| 2023 | $6,508 | $190,659 | $40,000 | $150,659 |
| 2022 | $4,623 | $144,933 | $40,000 | $104,933 |
| 2021 | $4,352 | $129,154 | $36,000 | $93,154 |
| 2020 | $4,101 | $121,681 | $36,000 | $85,681 |
| 2019 | $3,873 | $114,079 | $30,000 | $84,079 |
| 2018 | $3,746 | $110,342 | $30,000 | $80,342 |
| 2017 | $3,618 | $107,140 | $30,000 | $77,140 |
| 2016 | $2,849 | $83,912 | $30,000 | $53,912 |
| 2015 | $2,717 | $79,912 | $26,000 | $53,912 |
| 2014 | $2,545 | $74,740 | $22,000 | $52,740 |
Source: Public Records
Map
Nearby Homes
- 330 Pineneedle Rd
- 375 Best Dr
- 663 Oglethorpe Ave
- 406 Sunset Dr
- 282 Holman Ave
- 155 Sylvia Cir
- 271 King Ave
- 215 Holman Ave
- 65 Jefferson Cir
- 923 Hill St
- 970 Oglethorpe Ave
- 189 Glenhaven Ave
- 1398 W Hancock Ave
- 110 Valley St
- 1196 W Hancock Ave Unit 1
- 1198 W West Hancock Ave W
- 947 N Chase St
- 105 Magnolia Terrace
- 1080 Oglethorpe Ave
- 160 Miller St
- 447 Oglethorpe Ave
- 411 Oglethorpe Ave
- 425 Willow Run
- 449 Oglethorpe Ave
- 455 Oglethorpe Ave
- 220 Oglethorpe Terrace
- 210 Oglethorpe Terrace
- 397 Oglethorpe Ave
- 240 Oglethorpe Terrace
- 370 Willow Run
- 260 Oglethorpe Terrace
- 360 Willow Run
- 355 Oglethorpe Ave
- 497 Oglethorpe Ave
- 350 Willow Run
- 205 Oglethorpe Terrace
- 382 Sanders Ct
- 215 Oglethorpe Terrace
- 255 Oglethorpe Terrace
- 300 Oglethorpe Terrace
Your Personal Tour Guide
Ask me questions while you tour the home.