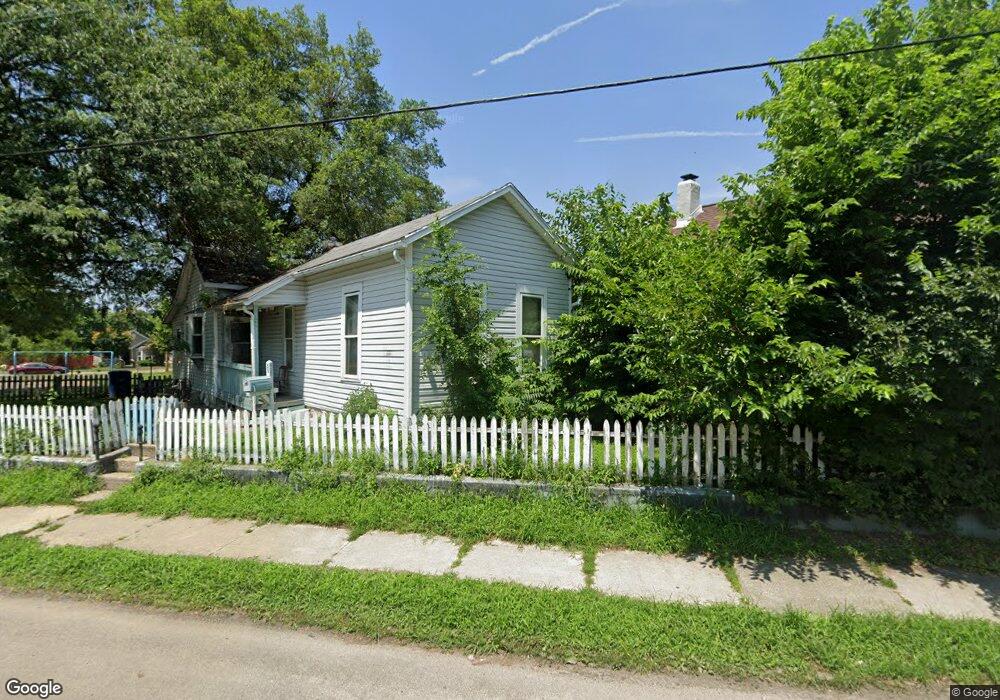
425 Pierce St Dayton, OH 45410
Twin Towers NeighborhoodEstimated Value: $54,000 - $96,000
2
Beds
1
Bath
824
Sq Ft
$87/Sq Ft
Est. Value
About This Home
This home is located at 425 Pierce St, Dayton, OH 45410 and is currently estimated at $71,876, approximately $87 per square foot. 425 Pierce St is a home located in Montgomery County with nearby schools including Ruskin Elementary School, Kiser Elementary, and Emerson Academy.
Ownership History
Date
Name
Owned For
Owner Type
Purchase Details
Closed on
Jul 29, 2002
Sold by
Us Bank National Assn
Bought by
Maccabee Daniel L and Maccabee Ann Marie
Current Estimated Value
Home Financials for this Owner
Home Financials are based on the most recent Mortgage that was taken out on this home.
Original Mortgage
$14,280
Interest Rate
6.13%
Mortgage Type
New Conventional
Purchase Details
Closed on
Jan 31, 2002
Sold by
Vermillion Steven
Bought by
U S Bank National Assn
Purchase Details
Closed on
Nov 8, 2001
Sold by
Vermillion Steven
Bought by
Equicredit Corp Of Ohio
Purchase Details
Closed on
Jul 13, 1999
Sold by
Darwin Jones
Bought by
Vermillion Steven and Williams Natasha
Home Financials for this Owner
Home Financials are based on the most recent Mortgage that was taken out on this home.
Original Mortgage
$56,700
Interest Rate
7.88%
Mortgage Type
Stand Alone First
Purchase Details
Closed on
Aug 23, 1994
Sold by
Nishioka Walter K
Bought by
Jones Darwin Lee
Create a Home Valuation Report for This Property
The Home Valuation Report is an in-depth analysis detailing your home's value as well as a comparison with similar homes in the area
Home Values in the Area
Average Home Value in this Area
Purchase History
| Date | Buyer | Sale Price | Title Company |
|---|---|---|---|
| Maccabee Daniel L | $17,900 | First Title Agency Inc | |
| Us Bank National Assn | -- | -- | |
| U S Bank National Assn | $24,000 | -- | |
| Equicredit Corp Of Ohio | $24,000 | -- | |
| Vermillion Steven | $60,000 | Royal Land Title Agency | |
| Jones Darwin Lee | -- | -- |
Source: Public Records
Mortgage History
| Date | Status | Borrower | Loan Amount |
|---|---|---|---|
| Closed | Us Bank National Assn | $14,280 | |
| Previous Owner | Vermillion Steven | $56,700 |
Source: Public Records
Tax History Compared to Growth
Tax History
| Year | Tax Paid | Tax Assessment Tax Assessment Total Assessment is a certain percentage of the fair market value that is determined by local assessors to be the total taxable value of land and additions on the property. | Land | Improvement |
|---|---|---|---|---|
| 2024 | $476 | $7,960 | $1,940 | $6,020 |
| 2023 | $476 | $7,960 | $1,940 | $6,020 |
| 2022 | $609 | $7,960 | $1,940 | $6,020 |
| 2021 | $606 | $7,960 | $1,940 | $6,020 |
| 2020 | $605 | $7,960 | $1,940 | $6,020 |
| 2019 | $561 | $6,560 | $1,940 | $4,620 |
| 2018 | $562 | $6,560 | $1,940 | $4,620 |
| 2017 | $558 | $6,560 | $1,940 | $4,620 |
| 2016 | $629 | $7,090 | $1,940 | $5,150 |
| 2015 | $597 | $7,090 | $1,940 | $5,150 |
| 2014 | $597 | $7,090 | $1,940 | $5,150 |
| 2012 | -- | $10,930 | $1,880 | $9,050 |
Source: Public Records
Map
Nearby Homes
- 216 Fillmore St
- 226 Fillmore St Unit 224
- 239 Fillmore St
- 937 Steele Ave
- 1049 Wyoming St
- 51 Little St
- 1130 Demphle Ave
- 284 Mcclure St
- 1154 Demphle Ave
- 357 Xenia Ave
- 117 Heaton Ave
- 1574 Wayne Ave Unit 1572
- 1000 Xenia Ave
- 215 Heaton Ave
- 122 Heaton Ave
- 208 Heaton Ave
- 27 Margaret St
- 40 Greenwood Ave
- 40 Greenwood Ave Unit 38 - 40
- 566 Wyoming St