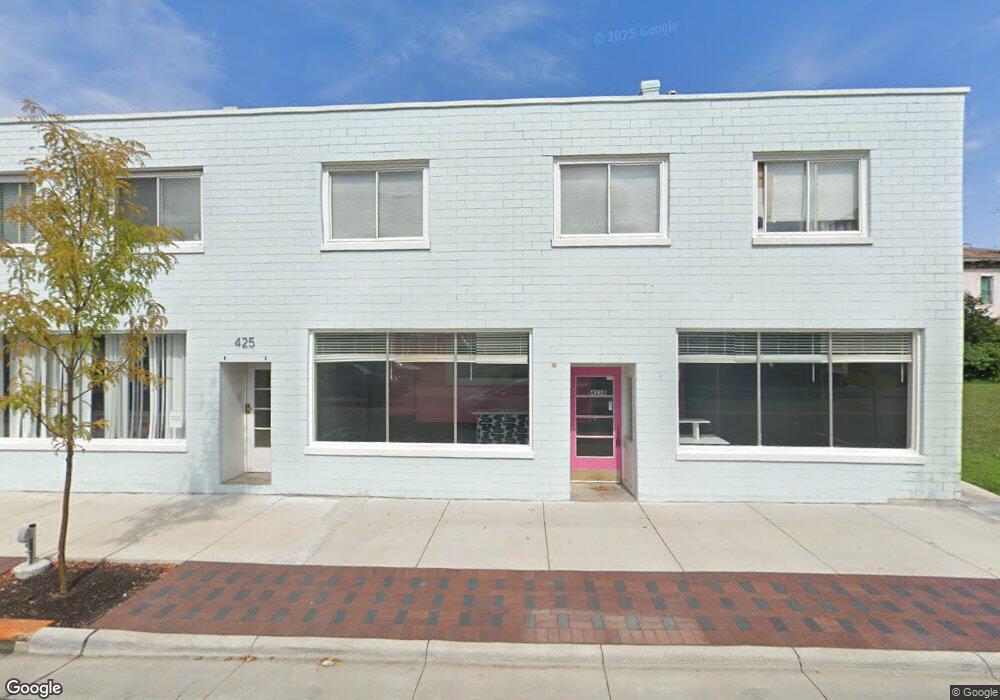
425 S Main St Franklin, OH 45005
Estimated Value: $168,000
1
Bed
1
Bath
400
Sq Ft
$420/Sq Ft
Est. Value
About This Home
This home is located at 425 S Main St, Franklin, OH 45005 and is currently estimated at $168,000, approximately $420 per square foot. 425 S Main St is a home located in Warren County with nearby schools including Franklin High School.
Ownership History
Date
Name
Owned For
Owner Type
Purchase Details
Closed on
Aug 22, 2022
Sold by
Malhotra Family Llc
Bought by
Equity Point Investments Inc
Current Estimated Value
Home Financials for this Owner
Home Financials are based on the most recent Mortgage that was taken out on this home.
Original Mortgage
$120,000
Outstanding Balance
$101,562
Interest Rate
4.58%
Mortgage Type
New Conventional
Estimated Equity
$66,438
Purchase Details
Closed on
Aug 31, 2005
Sold by
Malhotra Family Lp
Bought by
Malhotra Family Llc
Purchase Details
Closed on
Sep 13, 1993
Sold by
Malhotra Ramesh and Malhotra Christ
Bought by
Malhotra and Malhotra Ramesh
Purchase Details
Closed on
Nov 1, 1988
Sold by
Betzler Mary B and Betzler Mary B
Bought by
Betzler and Betzler William F
Purchase Details
Closed on
Oct 11, 1988
Sold by
Betzler Allen F and Betzler Mary
Bought by
Betzler and Betzler Mary B
Create a Home Valuation Report for This Property
The Home Valuation Report is an in-depth analysis detailing your home's value as well as a comparison with similar homes in the area
Home Values in the Area
Average Home Value in this Area
Purchase History
| Date | Buyer | Sale Price | Title Company |
|---|---|---|---|
| Equity Point Investments Inc | $150,666 | None Listed On Document | |
| Malhotra Family Llc | -- | -- | |
| Malhotra | -- | -- | |
| Betzler | -- | -- | |
| Betzler | -- | -- |
Source: Public Records
Mortgage History
| Date | Status | Borrower | Loan Amount |
|---|---|---|---|
| Open | Equity Point Investments Inc | $120,000 |
Source: Public Records
Tax History Compared to Growth
Tax History
| Year | Tax Paid | Tax Assessment Tax Assessment Total Assessment is a certain percentage of the fair market value that is determined by local assessors to be the total taxable value of land and additions on the property. | Land | Improvement |
|---|---|---|---|---|
| 2024 | $388 | $8,070 | $2,800 | $5,270 |
| 2023 | $306 | $5,705 | $1,540 | $43,505 |
| 2022 | $300 | $5,705 | $1,540 | $4,165 |
| 2021 | $285 | $5,705 | $1,540 | $4,165 |
| 2020 | $293 | $5,187 | $1,400 | $3,787 |
| 2019 | $267 | $5,187 | $1,400 | $3,787 |
| 2018 | $268 | $5,187 | $1,400 | $3,787 |
| 2017 | $274 | $4,858 | $1,330 | $3,528 |
| 2016 | $279 | $4,858 | $1,330 | $3,528 |
| 2015 | $279 | $4,858 | $1,330 | $3,528 |
| 2014 | $286 | $4,860 | $1,330 | $3,530 |
| 2013 | $244 | $5,110 | $1,400 | $3,710 |
Source: Public Records
Map
Nearby Homes