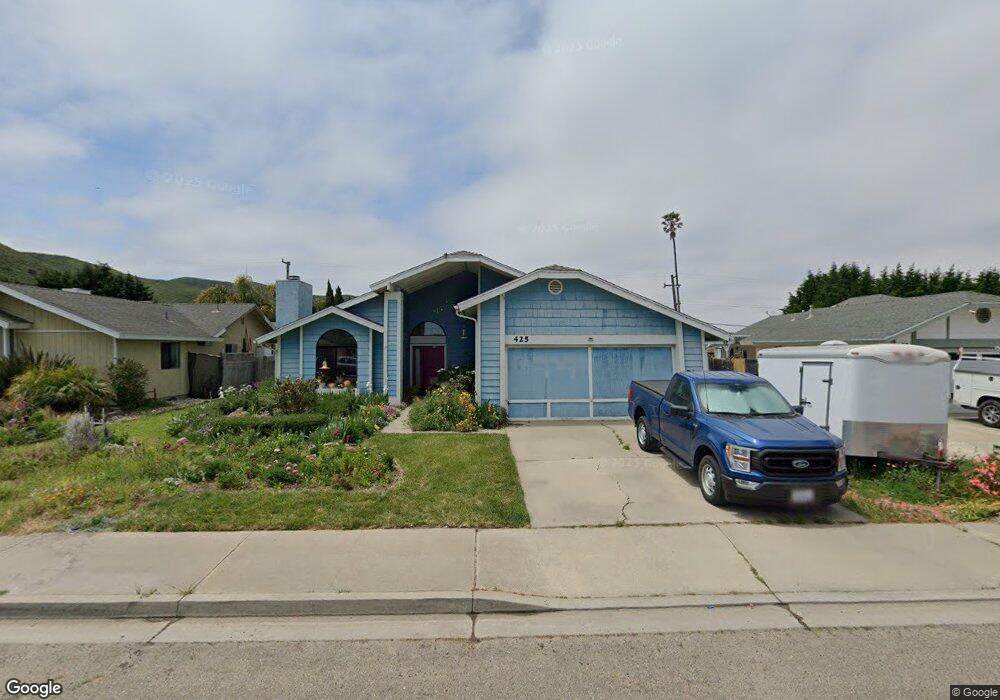
425 S Sage St Lompoc, CA 93436
West Lompoc NeighborhoodEstimated Value: $544,000 - $570,329
3
Beds
2
Baths
1,421
Sq Ft
$396/Sq Ft
Est. Value
About This Home
This home is located at 425 S Sage St, Lompoc, CA 93436 and is currently estimated at $562,832, approximately $396 per square foot. 425 S Sage St is a home located in Santa Barbara County with nearby schools including Miguelito Elementary School, Lompoc Valley Middle School, and Lompoc High School.
Ownership History
Date
Name
Owned For
Owner Type
Purchase Details
Closed on
Jun 12, 2000
Sold by
Bishow Ronald S
Bought by
Laufer Robert E and Laufer Alice T
Current Estimated Value
Home Financials for this Owner
Home Financials are based on the most recent Mortgage that was taken out on this home.
Original Mortgage
$179,050
Outstanding Balance
$63,347
Interest Rate
8.27%
Estimated Equity
$499,485
Purchase Details
Closed on
Mar 4, 1999
Sold by
Foley Janie M
Bought by
Foley Janie M and Bishow Ronald S
Purchase Details
Closed on
Nov 30, 1994
Sold by
Bishow Ronald S
Bought by
Bishow Ronald S
Home Financials for this Owner
Home Financials are based on the most recent Mortgage that was taken out on this home.
Original Mortgage
$120,000
Interest Rate
9.1%
Create a Home Valuation Report for This Property
The Home Valuation Report is an in-depth analysis detailing your home's value as well as a comparison with similar homes in the area
Home Values in the Area
Average Home Value in this Area
Purchase History
| Date | Buyer | Sale Price | Title Company |
|---|---|---|---|
| Laufer Robert E | $188,500 | First American Title | |
| Foley Janie M | -- | -- | |
| Bishow Ronald S | -- | Stewart Title |
Source: Public Records
Mortgage History
| Date | Status | Borrower | Loan Amount |
|---|---|---|---|
| Open | Laufer Robert E | $179,050 | |
| Previous Owner | Bishow Ronald S | $120,000 |
Source: Public Records
Tax History Compared to Growth
Tax History
| Year | Tax Paid | Tax Assessment Tax Assessment Total Assessment is a certain percentage of the fair market value that is determined by local assessors to be the total taxable value of land and additions on the property. | Land | Improvement |
|---|---|---|---|---|
| 2025 | $3,097 | $289,694 | $115,258 | $174,436 |
| 2023 | $3,097 | $278,447 | $110,784 | $167,663 |
| 2022 | $3,040 | $272,988 | $108,612 | $164,376 |
| 2021 | $3,072 | $267,636 | $106,483 | $161,153 |
| 2020 | $3,039 | $264,893 | $105,392 | $159,501 |
| 2019 | $2,987 | $259,700 | $103,326 | $156,374 |
| 2018 | $2,939 | $254,608 | $101,300 | $153,308 |
| 2017 | $2,884 | $249,616 | $99,314 | $150,302 |
| 2016 | $2,830 | $244,722 | $97,367 | $147,355 |
| 2015 | $2,808 | $241,047 | $95,905 | $145,142 |
| 2014 | $2,767 | $236,326 | $94,027 | $142,299 |
Source: Public Records
Map
Nearby Homes
- 401 S R St
- 1328 W Willow Ave
- 413 S O Place
- 1105 W Cypress Ave Unit J
- 1213 W Cypress Ave Unit D
- 1317 W Cypress Ave Unit A2
- 428 S Z St
- 23 Village Circle Dr
- 309 N V St
- 328 N X St
- 1426 Plum Ave
- 135 N J St
- 137 N J St
- 300 W Walnut Ave
- 500 N Z St
- 6 Santa Clara Dr
- 531 N O St
- 1212 W Prune Ave
- 612 University Dr
- 122 N G St