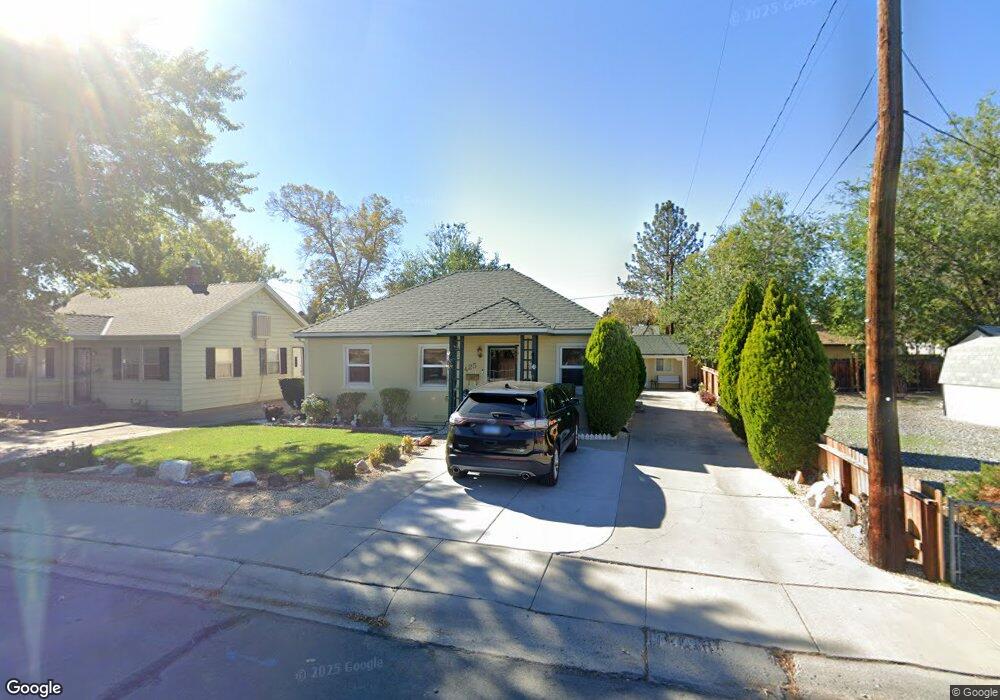
425 Stanford Way Sparks, NV 89431
Downtown Sparks NeighborhoodEstimated Value: $421,547 - $579,000
5
Beds
4
Baths
1,600
Sq Ft
$323/Sq Ft
Est. Value
About This Home
This home is located at 425 Stanford Way, Sparks, NV 89431 and is currently estimated at $516,137, approximately $322 per square foot. 425 Stanford Way is a home located in Washoe County with nearby schools including Lincoln Park Elementary School, George L Dilworth Middle School, and Sparks High School.
Ownership History
Date
Name
Owned For
Owner Type
Purchase Details
Closed on
Aug 9, 2005
Sold by
Bevels Kimberly
Bought by
Bevels Kimberly
Current Estimated Value
Home Financials for this Owner
Home Financials are based on the most recent Mortgage that was taken out on this home.
Original Mortgage
$115,000
Outstanding Balance
$59,332
Interest Rate
5.48%
Mortgage Type
New Conventional
Estimated Equity
$456,805
Purchase Details
Closed on
Jun 4, 2003
Sold by
Terrell Norma Jean
Bought by
Bevels Kimberly
Home Financials for this Owner
Home Financials are based on the most recent Mortgage that was taken out on this home.
Original Mortgage
$82,000
Interest Rate
5.71%
Mortgage Type
Unknown
Purchase Details
Closed on
Oct 25, 1996
Sold by
Roman Teresa L
Bought by
Terrell Norma Jean and Bevels Kimberly
Home Financials for this Owner
Home Financials are based on the most recent Mortgage that was taken out on this home.
Original Mortgage
$70,000
Interest Rate
8.11%
Purchase Details
Closed on
May 16, 1994
Sold by
Roman Luis P and Roman Pedro M
Bought by
Roman Teresa L
Create a Home Valuation Report for This Property
The Home Valuation Report is an in-depth analysis detailing your home's value as well as a comparison with similar homes in the area
Home Values in the Area
Average Home Value in this Area
Purchase History
| Date | Buyer | Sale Price | Title Company |
|---|---|---|---|
| Bevels Kimberly | -- | First Centennial Title Co | |
| Bevels Kimberly | -- | First Centennial Title Co | |
| Terrell Norma Jean | $119,000 | Western Title Company Inc | |
| Roman Teresa L | -- | -- |
Source: Public Records
Mortgage History
| Date | Status | Borrower | Loan Amount |
|---|---|---|---|
| Open | Bevels Kimberly | $115,000 | |
| Closed | Bevels Kimberly | $82,000 | |
| Previous Owner | Terrell Norma Jean | $70,000 |
Source: Public Records
Tax History Compared to Growth
Tax History
| Year | Tax Paid | Tax Assessment Tax Assessment Total Assessment is a certain percentage of the fair market value that is determined by local assessors to be the total taxable value of land and additions on the property. | Land | Improvement |
|---|---|---|---|---|
| 2025 | $1,097 | $66,950 | $41,720 | $25,230 |
| 2024 | $1,097 | $63,657 | $38,710 | $24,947 |
| 2023 | $1,066 | $62,442 | $39,025 | $23,417 |
| 2022 | $1,035 | $50,756 | $31,360 | $19,396 |
| 2021 | $1,005 | $43,218 | $24,080 | $19,138 |
| 2020 | $974 | $44,523 | $25,480 | $19,043 |
| 2019 | $946 | $40,693 | $22,470 | $18,223 |
| 2018 | $920 | $32,895 | $15,190 | $17,705 |
| 2017 | $892 | $31,611 | $14,000 | $17,611 |
| 2016 | $870 | $29,105 | $11,200 | $17,905 |
| 2015 | $869 | $26,004 | $8,050 | $17,954 |
| 2014 | $846 | $24,116 | $7,000 | $17,116 |
| 2013 | -- | $22,506 | $5,530 | $16,976 |
Source: Public Records
Map
Nearby Homes
- 10 Lincoln Way
- 400 4th St
- 402 5th St
- 345 H St
- 360 E Lincoln Way
- 300 I St
- 324 Victorian Ave
- 445 Pine Meadows Dr Unit E25
- 560 Nichols Blvd
- 512 Victorian Ave
- 601 Oakwood Dr Unit 4
- 611 Oakwood Dr Unit 1
- 604 Oakwood Dr Unit 1
- 644 Oakwood Dr Unit 2
- 385 Gleeson Way
- 684 Oakwood Dr Unit 3
- 3 Strobel Way
- 621 9th St
- 370 O'Brien Way
- 1703 1st St
- 423 Stanford Way
- 4 Lincoln Way
- 421 Stanford Way
- 6 Lincoln Way
- 324 Fodrin Way
- 419 Stanford Way
- 322 Fodrin Way
- 8 Lincoln Way
- 320 Fodrin Way
- 460 Stanford Way
- 490 Stanford Way
- 417 Stanford Way
- 450 Stanford Way
- 5 Lincoln Way
- 318 Fodrin Way
- 1 Lincoln Way
- 3 Lincoln Way
- 415 Stanford Way
- 17 E Lincoln Way
- 30 Suzanne Way