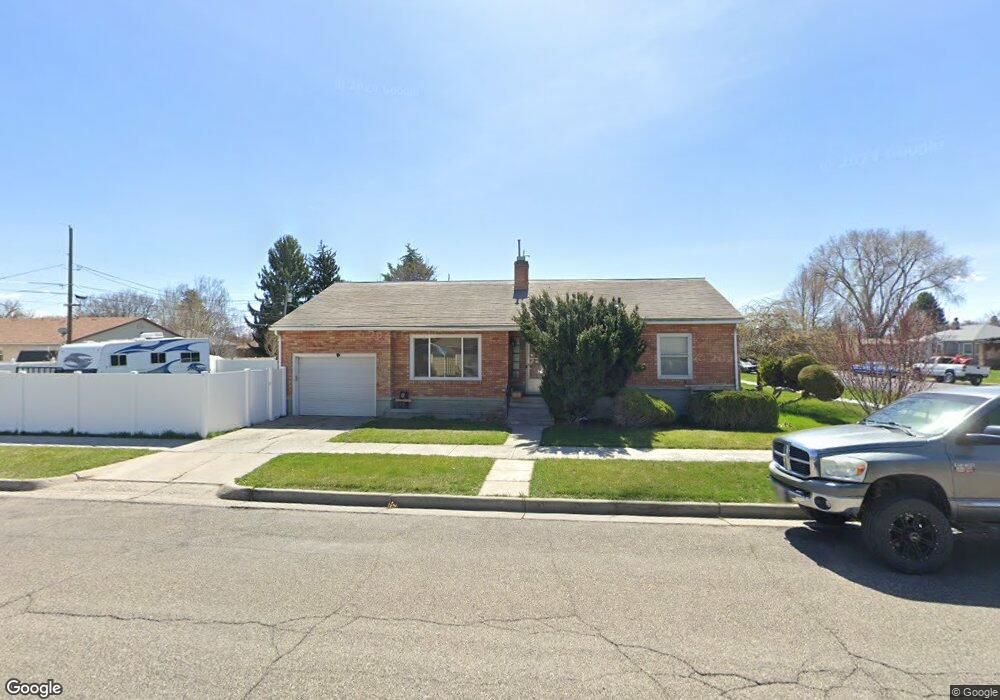
425 W 19th St Burley, ID 83318
Estimated Value: $293,259 - $336,000
5
Beds
2
Baths
2,151
Sq Ft
$146/Sq Ft
Est. Value
About This Home
This home is located at 425 W 19th St, Burley, ID 83318 and is currently estimated at $315,065, approximately $146 per square foot. 425 W 19th St is a home located in Cassia County with nearby schools including White Pine Elementary School, Mountain View Elementary School, and Burley Junior High School.
Ownership History
Date
Name
Owned For
Owner Type
Purchase Details
Closed on
Apr 10, 2022
Sold by
Hernandez Maleno R and Hernandez Katherine M
Bought by
Hernandez Marc R and Hernandez Maleno R
Current Estimated Value
Purchase Details
Closed on
Apr 2, 2007
Sold by
Rowley Jason T and Rowley Natasha
Bought by
Hernandez Maleno R and Hernandez Katerine M
Home Financials for this Owner
Home Financials are based on the most recent Mortgage that was taken out on this home.
Original Mortgage
$99,000
Interest Rate
8.65%
Mortgage Type
Adjustable Rate Mortgage/ARM
Purchase Details
Closed on
Aug 18, 2005
Sold by
Anderson Kenneth Theron
Bought by
Rowley Jason T and Rowley Natasha
Home Financials for this Owner
Home Financials are based on the most recent Mortgage that was taken out on this home.
Original Mortgage
$99,450
Interest Rate
5.56%
Mortgage Type
New Conventional
Create a Home Valuation Report for This Property
The Home Valuation Report is an in-depth analysis detailing your home's value as well as a comparison with similar homes in the area
Home Values in the Area
Average Home Value in this Area
Purchase History
| Date | Buyer | Sale Price | Title Company |
|---|---|---|---|
| Hernandez Marc R | -- | None Listed On Document | |
| Hernandez Maleno R | -- | Land Title & Escrow | |
| Rowley Jason T | -- | Land Title & Escrow |
Source: Public Records
Mortgage History
| Date | Status | Borrower | Loan Amount |
|---|---|---|---|
| Previous Owner | Hernandez Maleno R | $99,000 | |
| Previous Owner | Rowley Jason T | $99,450 |
Source: Public Records
Tax History Compared to Growth
Tax History
| Year | Tax Paid | Tax Assessment Tax Assessment Total Assessment is a certain percentage of the fair market value that is determined by local assessors to be the total taxable value of land and additions on the property. | Land | Improvement |
|---|---|---|---|---|
| 2024 | $1,144 | $289,915 | $47,840 | $242,075 |
| 2023 | $1,405 | $289,915 | $47,840 | $242,075 |
| 2022 | $1,301 | $239,189 | $34,040 | $205,149 |
| 2021 | $1,336 | $189,712 | $25,515 | $164,197 |
| 2020 | $1,032 | $131,084 | $10,581 | $120,503 |
| 2019 | $1,007 | $126,149 | $9,983 | $116,166 |
| 2017 | $950 | $114,357 | $9,075 | $105,282 |
| 2016 | $920 | $111,291 | $9,075 | $102,216 |
| 2015 | $915 | $110,466 | $8,250 | $102,216 |
| 2014 | $902 | $110,402 | $8,250 | $102,152 |
| 2013 | $902 | $110,402 | $8,250 | $102,152 |
Source: Public Records
Map
Nearby Homes
- 1942 Burton Ave
- 1719 Burton Ave
- 201 W 19th St
- 1729 Yale Ave
- 2140 Daven Place
- 1610 Burton Ave
- 590 W 24th St
- 1501 Miller Ave Unit 3
- 2431 Dorchester Ave
- 628 W 24th St
- 1600 Hansen Ave
- 2435 Oakley Ave Unit Burley, ID
- 1401 Oakley Ave
- 320 E 23rd Dr
- 500 E 19th St
- 2593 Burton Ave
- 8 E Island Ct
- 1519 Almo Ave
- 1635 Elba Ave
- 221 W Main St
- 1911 Burton Ave
- 1919 Burton Ave
- 434 W 19th St
- 1900 Conant Ave
- 1927 Burton Ave
- 1835 Burton Ave
- 1908 Conant Ave
- 1842 Conant Ave
- 1918 Conant Ave
- 1935 Burton Ave
- 1900 Burton Ave
- 1910 Burton Ave
- 1830 Conant Ave
- 1827 Burton Ave
- 1842 Burton Ave
- 1918 Burton Ave
- 1941 Burton Ave
- 1940 Conant Ave
- 1926 Burton Ave
- 1818 Conant Ave