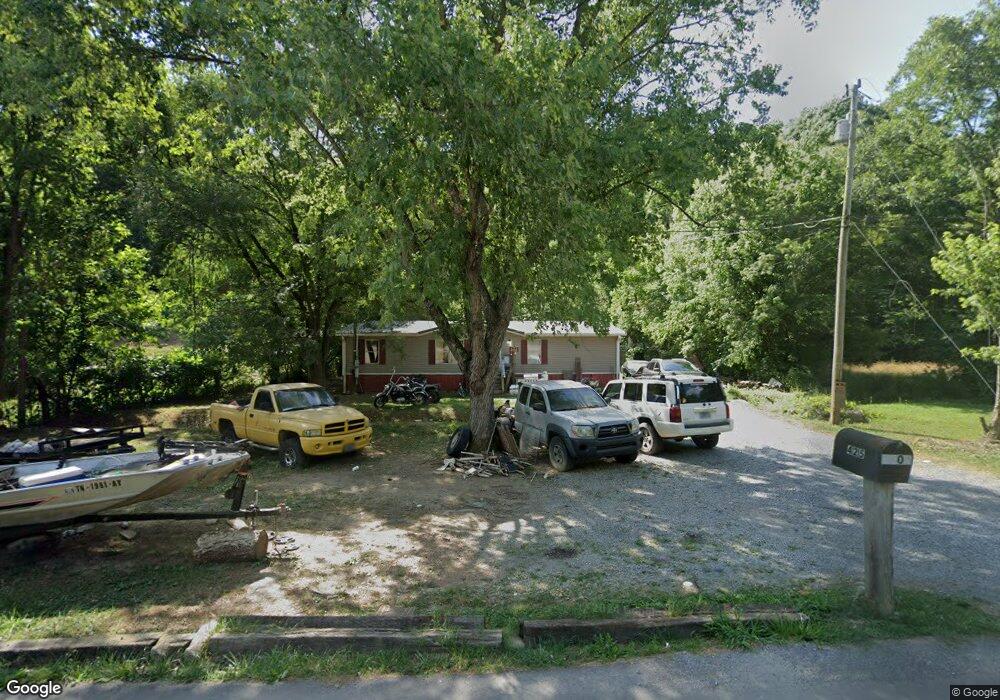
425 Woodlyn Rd Johnson City, TN 37601
Estimated Value: $261,000 - $329,000
4
Beds
2
Baths
1,456
Sq Ft
$206/Sq Ft
Est. Value
About This Home
This home is located at 425 Woodlyn Rd, Johnson City, TN 37601 and is currently estimated at $300,000, approximately $206 per square foot. 425 Woodlyn Rd is a home located in Washington County with nearby schools including Boones Creek Elementary School, Boones Creek Elementary School, and Daniel Boone High School.
Ownership History
Date
Name
Owned For
Owner Type
Purchase Details
Closed on
Oct 27, 2010
Sold by
Vanderbilt Mtg
Bought by
Hickman Allen
Current Estimated Value
Purchase Details
Closed on
Jun 25, 2010
Sold by
Crawford Joshua Clayton
Bought by
Vanderbilt Mtg
Purchase Details
Closed on
May 25, 2005
Sold by
Clayton Crawford Joshua A
Bought by
Clayton Crawford Joshua
Home Financials for this Owner
Home Financials are based on the most recent Mortgage that was taken out on this home.
Original Mortgage
$46,000
Interest Rate
5.8%
Purchase Details
Closed on
May 16, 2005
Bought by
Crawford Joshua Clayton and Napier Theresa
Home Financials for this Owner
Home Financials are based on the most recent Mortgage that was taken out on this home.
Original Mortgage
$46,000
Interest Rate
5.8%
Create a Home Valuation Report for This Property
The Home Valuation Report is an in-depth analysis detailing your home's value as well as a comparison with similar homes in the area
Home Values in the Area
Average Home Value in this Area
Purchase History
| Date | Buyer | Sale Price | Title Company |
|---|---|---|---|
| Hickman Allen | $20,000 | -- | |
| Vanderbilt Mtg | $13,500 | -- | |
| Clayton Crawford Joshua | -- | -- | |
| Crawford Joshua Clayton | -- | -- |
Source: Public Records
Mortgage History
| Date | Status | Borrower | Loan Amount |
|---|---|---|---|
| Previous Owner | Crawford Joshua Clayton | $46,000 |
Source: Public Records
Tax History Compared to Growth
Tax History
| Year | Tax Paid | Tax Assessment Tax Assessment Total Assessment is a certain percentage of the fair market value that is determined by local assessors to be the total taxable value of land and additions on the property. | Land | Improvement |
|---|---|---|---|---|
| 2024 | $565 | $33,050 | $5,175 | $27,875 |
| 2023 | $261 | $12,150 | $0 | $0 |
| 2022 | $261 | $12,150 | $3,150 | $9,000 |
| 2021 | $261 | $12,150 | $3,150 | $9,000 |
| 2020 | $261 | $12,150 | $3,150 | $9,000 |
| 2019 | $155 | $12,150 | $3,150 | $9,000 |
| 2018 | $155 | $6,525 | $3,150 | $3,375 |
| 2017 | $155 | $6,525 | $3,150 | $3,375 |
| 2016 | $155 | $6,525 | $3,150 | $3,375 |
| 2015 | $129 | $6,525 | $3,150 | $3,375 |
| 2014 | $129 | $6,525 | $3,150 | $3,375 |
Source: Public Records
Map
Nearby Homes
- 2856 Watauga Rd
- 126 Hughes St
- 2239 E Fairview Ave
- 807 Long St
- Hillside Hillside Dr
- 119 Hillside Dr
- 115 Hillside Dr
- 2112 E Watauga Ave
- 570 Sedgewick Way
- 2107 E Watauga Ave
- 909 Pine Grove Ave
- 1213 Glynridge St
- 119 Carrville Ave
- 373 Dalewood Rd
- 1448 Piedmont St
- 1808 E Myrtle Ave
- 1700 E Millard St
- 1701 E Millard St
- 1917 Club Dr
- 918 Riverview Dr
- 431 Woodlyn Rd
- 431 Woodlyn Rd
- 417 Woodlyn Rd
- 407 Woodlyn Rd
- 441 Woodlyn Rd
- 449 Woodlyn Rd
- 401 Woodlyn Rd
- 463 Woodlyn Rd
- 463 Woodlyn Rd
- 106 Weaver Hollow Rd
- 155 Pinewood Rd
- 210 Dalewood Dr
- Tbd Weaver Hollow Rd
- 0 Weaver Hollow Rd
- 190 Weaver Hollow Rd
- 113 Weaver Hollow Rd
- 236 Dalewood Dr
- 226 Dalewood Dr
- 357 Woodlyn Rd
- 0 Woodlyn Rd