
425 Wyndward Point Dr Hartwell, GA 30643
Estimated payment $5,536/month
Highlights
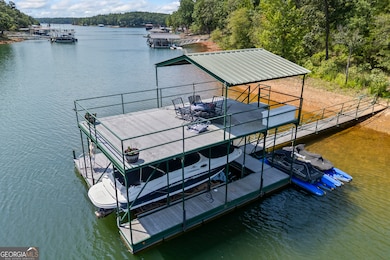
- Lake Front
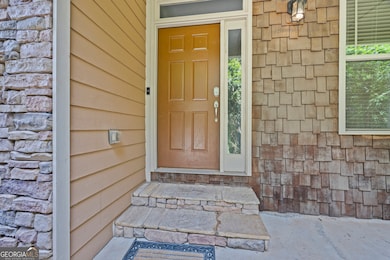
- Craftsman Architecture
- Deck
- Docks
- Community Lake
- Main Floor Primary Bedroom
About This Home
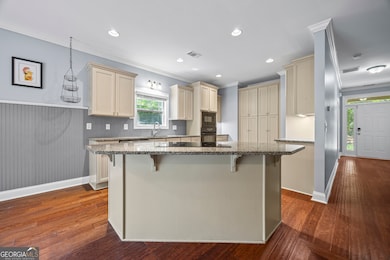
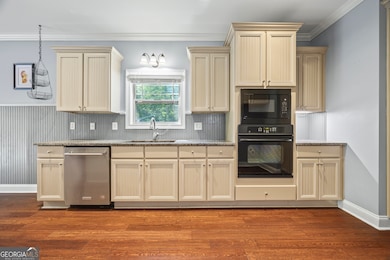
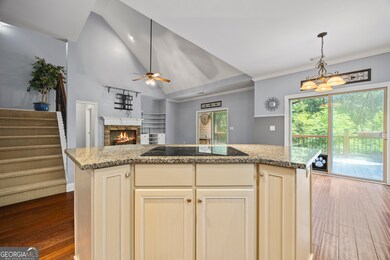
Welcome to 425 Wyndward Point Dr in Hartwell, GA-a spacious 6-bedroom, 4-bathroom lakefront home that offers the perfect blend of comfort, functionality, and recreation. A brand NEW roof was just installed this summer, giving you peace of mind and added value right from the start! This thoughtfully designed property features a versatile layout with a dedicated office, game room, and a fully finished basement that includes an unfinished storage area with plenty of space for all your lake toys. Enjoy a nice stroll down the path to your grandfathered-in party dock! Inside, the living room is warm and welcoming with high ceilings and a cozy fireplace, while the open kitchen is made for entertaining, with an island that seamlessly connects to the living area. Step out onto the private back deck and soak in the serenity of your peaceful, wooded lot. With a 2-car garage and flexible spaces throughout, this home is perfect for full-time living or the ultimate weekend retreat on the lake.
Home Details
Home Type
- Single Family
Est. Annual Taxes
- $4,513
Year Built
- Built in 2008
Lot Details
- 0.5 Acre Lot
- Lake Front
- Sloped Lot
Parking
- Garage
Home Design
- Craftsman Architecture
- Traditional Architecture
- Country Style Home
- Composition Roof
- Concrete Siding
- Stone Siding
- Stone
Interior Spaces
- 3,924 Sq Ft Home
- 3-Story Property
- Rear Stairs
- Bookcases
- High Ceiling
- 1 Fireplace
- Entrance Foyer
- Family Room
- Combination Dining and Living Room
- Home Office
- Loft
- Game Room
- Carpet
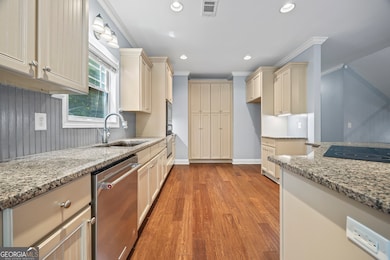
Kitchen
- Country Kitchen
- Oven or Range
- Microwave
- Dishwasher
- Stainless Steel Appliances
- Kitchen Island
Bedrooms and Bathrooms
- 6 Bedrooms | 2 Main Level Bedrooms
- Primary Bedroom on Main
- Walk-In Closet
- In-Law or Guest Suite
- Double Vanity
- Soaking Tub
- Separate Shower
Laundry
- Laundry in Mud Room
- Laundry Room
Finished Basement
- Basement Fills Entire Space Under The House
- Interior and Exterior Basement Entry
- Boat door in Basement
- Finished Basement Bathroom
Outdoor Features
- Army Corps Of Engineers Controlled
- Docks
- Dock Rights
- Deck
- Porch
Schools
- North Hart Elementary School
- Hart County Middle School
- Hart County High School
Utilities
- Cooling Available
- Heating Available
- Propane
- Well
- Electric Water Heater
- Septic Tank
Community Details
- No Home Owners Association
- Wyndward Pointe Subdivision
- Community Lake
Map
Home Values in the Area
Average Home Value in this Area
Tax History
| Year | Tax Paid | Tax Assessment Tax Assessment Total Assessment is a certain percentage of the fair market value that is determined by local assessors to be the total taxable value of land and additions on the property. | Land | Improvement |
|---|---|---|---|---|
| 2024 | $4,894 | $316,924 | $106,000 | $210,924 |
| 2023 | $4,746 | $285,022 | $106,000 | $179,022 |
| 2022 | $4,446 | $266,987 | $106,000 | $160,987 |
| 2021 | $4,013 | $216,344 | $72,000 | $144,344 |
| 2020 | $3,998 | $206,468 | $72,000 | $134,468 |
| 2019 | $3,768 | $192,764 | $64,800 | $127,964 |
| 2018 | $3,792 | $191,796 | $64,800 | $126,996 |
| 2017 | $3,794 | $190,864 | $64,800 | $126,064 |
| 2016 | $3,897 | $189,994 | $64,800 | $125,194 |
| 2015 | $3,646 | $187,264 | $64,800 | $122,464 |
| 2014 | $4,032 | $202,986 | $80,000 | $122,986 |
| 2013 | -- | $204,560 | $80,000 | $124,560 |
Property History
| Date | Event | Price | List to Sale | Price per Sq Ft |
|---|---|---|---|---|
| 10/21/2025 10/21/25 | Price Changed | $979,000 | -1.0% | $249 / Sq Ft |
| 08/29/2025 08/29/25 | Price Changed | $989,000 | -1.0% | $252 / Sq Ft |
| 07/29/2025 07/29/25 | Price Changed | $998,500 | -9.2% | $254 / Sq Ft |
| 07/23/2025 07/23/25 | For Sale | $1,100,000 | -- | $280 / Sq Ft |
Purchase History
| Date | Type | Sale Price | Title Company |
|---|---|---|---|
| Warranty Deed | $565,000 | -- | |
| Deed | $565,000 | -- | |
| Deed | $1,190,000 | -- | |
| Deed | $1,150,000 | -- |
Mortgage History
| Date | Status | Loan Amount | Loan Type |
|---|---|---|---|
| Previous Owner | $460,000 | New Conventional | |
| Previous Owner | $460,000 | New Conventional |
Source: Georgia MLS
MLS Number: 10570219
APN: C67B-063
Disclaimer: Certain information contained herein is derived from information provided by parties other than Homes.com. All information provided is deemed reliable, but is not guaranteed to be accurate and should be independently verified.
![]() The data relating to real estate for sale on this web site comes in part from the Broker Reciprocity Program of Georgia MLS. Real estate listings held by brokerage firms other than Redfin are marked with the Broker Reciprocity logo and detailed information about them includes the name of the listing brokers. Information deemed reliable but not guaranteed. Copyright 2025 Georgia MLS. All rights reserved.
The data relating to real estate for sale on this web site comes in part from the Broker Reciprocity Program of Georgia MLS. Real estate listings held by brokerage firms other than Redfin are marked with the Broker Reciprocity logo and detailed information about them includes the name of the listing brokers. Information deemed reliable but not guaranteed. Copyright 2025 Georgia MLS. All rights reserved.
- 370 Paradise Point Rd
- 209 Snowbird Ln
- 36 Crest Dr Unit Lot 23
- 40 Crest Dr Unit 24
- 85 Majestic Shores Trail
- 120 Providence Point Ln
- Branford Plan at Majestic Shores
- Montville Plan at Majestic Shores
- LOT 22 Majestic Shores Rd
- LOT 25 Majestic Shores Rd
- LOT 13 Majestic Shores Rd
- LOT 5 Majestic Shores Rd
- LOT E Majestic Shores Rd
- LOT 12 Majestic Shores Rd
- LOT 4 Majestic Shores Rd
- LOT 7 Majestic Shores Rd
- LOT 6 Majestic Shores Rd
- LOT E Majestic Shores Dr
- LOT 9 Majestic Shores Trail
- 1767 Milltown Rd Unit ID1302833P
- 160 Hugh Dorsey Rd Unit ID1302822P
- 220 Tuscarora Trail
- 575 Early Dr Unit ID1335909P
- 3148 Ridge Rd
- 533 Tom Cobb Dr Unit ID1302828P
- 101 Joy Ln Unit LAKEFRONT
- 184 Pecan Dr
- 93 Snyder Dr Unit ID1302832P
- 195 N Forest Ave
- 151 S Pointe Dr
- 95 N Jackson St Unit 1
- 49 Paisley Place
- 34 Depot St Unit 11
- 1463 Beacon Light Rd
- 411 Cade St
- 2453 Memorial Rd
- 1027 Smyzer
- 1025 Smyzer Rd
- 182 Moore Rd
