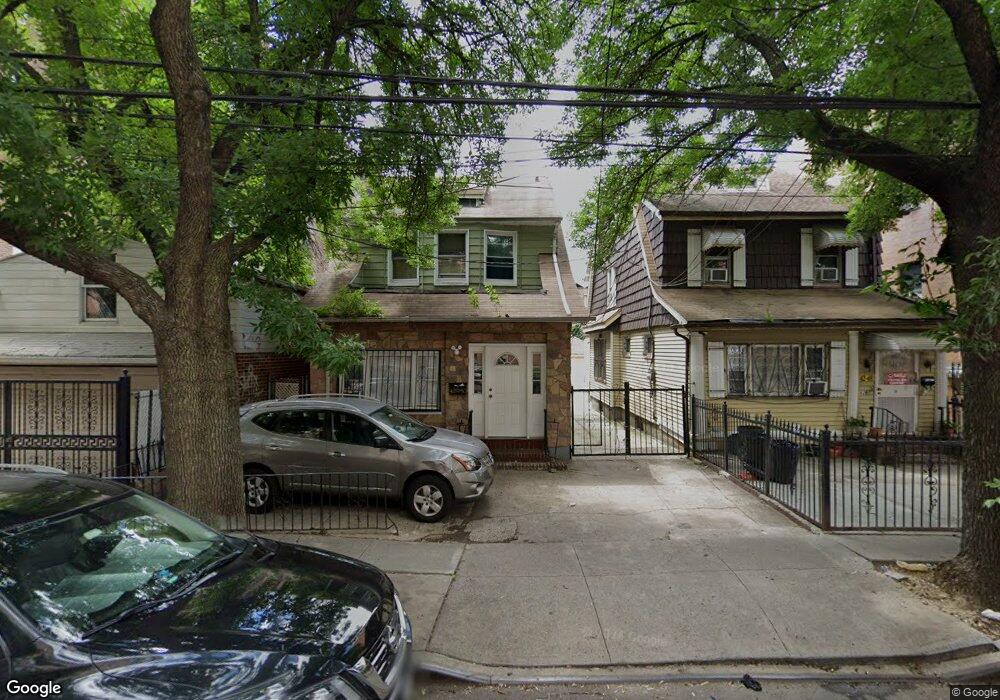
4250 Forley St Elmhurst, NY 11373
Elmhurst NeighborhoodEstimated Value: $1,045,000 - $1,284,000
--
Bed
--
Bath
1,913
Sq Ft
$612/Sq Ft
Est. Value
About This Home
This home is located at 4250 Forley St, Elmhurst, NY 11373 and is currently estimated at $1,170,432, approximately $611 per square foot. 4250 Forley St is a home located in Queens County with nearby schools including P.S. 19 Marino Jeantet, IS 73 - The Frank Sansivieri School, and Newtown High School.
Ownership History
Date
Name
Owned For
Owner Type
Purchase Details
Closed on
Apr 28, 2006
Sold by
Pimentel Rosa V
Bought by
Rivera Remigio
Current Estimated Value
Home Financials for this Owner
Home Financials are based on the most recent Mortgage that was taken out on this home.
Original Mortgage
$500,000
Outstanding Balance
$289,910
Interest Rate
6.42%
Mortgage Type
Purchase Money Mortgage
Estimated Equity
$880,522
Purchase Details
Closed on
Mar 2, 2001
Sold by
Ortgea Jorge A and Pimental Rosa V
Bought by
Pimentel Rosa V
Home Financials for this Owner
Home Financials are based on the most recent Mortgage that was taken out on this home.
Original Mortgage
$301,500
Interest Rate
7.05%
Mortgage Type
Purchase Money Mortgage
Purchase Details
Closed on
Mar 18, 1996
Sold by
Martinez Sergio and Martinez Noris
Bought by
Ortega Jorge A and Pimentel Rosa
Home Financials for this Owner
Home Financials are based on the most recent Mortgage that was taken out on this home.
Original Mortgage
$164,300
Interest Rate
7.31%
Create a Home Valuation Report for This Property
The Home Valuation Report is an in-depth analysis detailing your home's value as well as a comparison with similar homes in the area
Home Values in the Area
Average Home Value in this Area
Purchase History
| Date | Buyer | Sale Price | Title Company |
|---|---|---|---|
| Rivera Remigio | $625,000 | -- | |
| Pimentel Rosa V | -- | -- | |
| Ortega Jorge A | $173,000 | First American Title Ins Co |
Source: Public Records
Mortgage History
| Date | Status | Borrower | Loan Amount |
|---|---|---|---|
| Open | Rivera Remigio | $500,000 | |
| Previous Owner | Pimentel Rosa V | $301,500 | |
| Previous Owner | Ortega Jorge A | $164,300 |
Source: Public Records
Tax History Compared to Growth
Tax History
| Year | Tax Paid | Tax Assessment Tax Assessment Total Assessment is a certain percentage of the fair market value that is determined by local assessors to be the total taxable value of land and additions on the property. | Land | Improvement |
|---|---|---|---|---|
| 2025 | $7,397 | $39,035 | $11,789 | $27,246 |
| 2024 | $7,397 | $36,826 | $11,645 | $25,181 |
| 2023 | $7,397 | $36,826 | $11,110 | $25,716 |
| 2022 | $7,296 | $54,540 | $18,120 | $36,420 |
| 2021 | $7,256 | $56,760 | $18,120 | $38,640 |
| 2020 | $6,885 | $55,980 | $18,120 | $37,860 |
| 2019 | $6,420 | $56,760 | $18,120 | $38,640 |
| 2018 | $6,256 | $30,688 | $13,072 | $17,616 |
| 2017 | $6,208 | $30,455 | $13,120 | $17,335 |
| 2016 | $5,744 | $30,455 | $13,120 | $17,335 |
| 2015 | $3,465 | $27,108 | $14,643 | $12,465 |
| 2014 | $3,465 | $25,574 | $16,588 | $8,986 |
Source: Public Records
Map
Nearby Homes
- 42-87 Hampton St
- 92-29 Lamont Ave Unit 2K
- 92-29 Lamont Ave Unit 2
- 4239 Elbertson St
- 91-16 43rd Ave
- 91-08 43rd Ave
- 41-41 Denman St
- 93-09 43rd Ave
- 91-23 Corona Ave Unit 6B
- 91-23 Corona Ave Unit 2A
- 91-23 Corona Ave Unit 5E
- 91-23 Corona Ave Unit 5A
- 91-23 Corona Ave Unit 6C
- 91-23 Corona Ave Unit 4A
- 91-23 Corona Ave Unit 2F
- 9318 Lamont Ave
- 41-71 Gleane St
- 4209 Hampton St Unit 4A
- 4209 Hampton St Unit 4B
- 41-20 Elbertson St
- 4248 Forley St
- 4244 Forley St
- 9141 Lamont Ave
- 9143 Lamont Ave
- 4242 Forley St
- 9131 Lamont Ave
- 4249 Gleane St
- 4247 Gleane St
- 4240 Forley St
- 4243 Gleane St
- 4238 Forley St
- 4241 Gleane St
- 4243 Gleane St
- 4239 Gleane St
- 4245 Forley St
- 4245 Forley St Unit 3FL
- 42-37 Gleane St
- 4236 Forley St
- 4236 Forley St
- 42-34 Forley St Unit 2