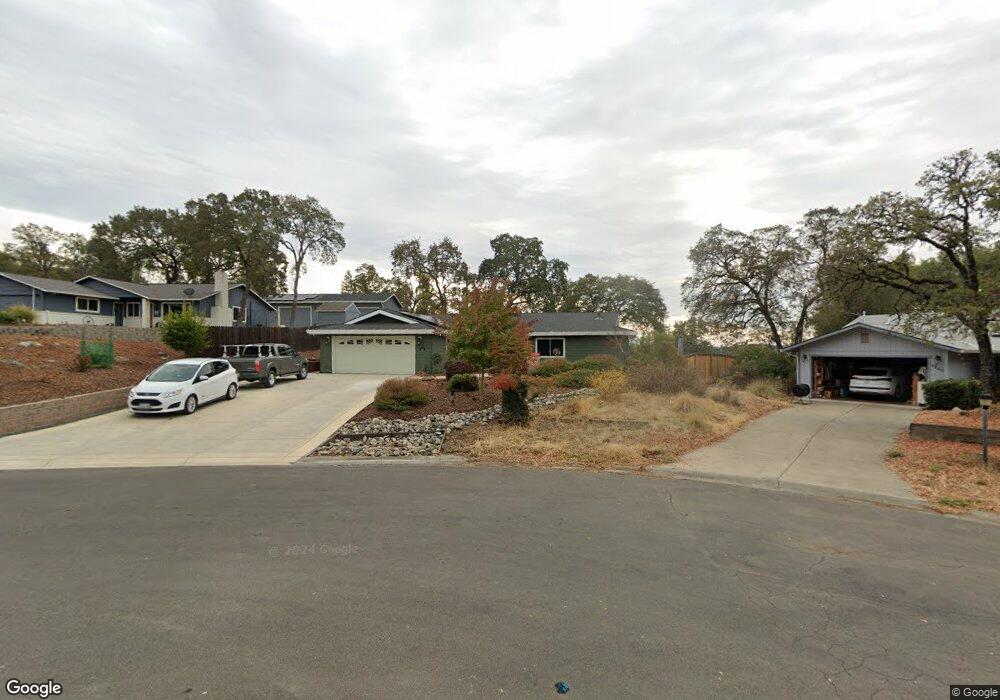
4252 Lorrain St Shingle Springs, CA 95682
Estimated Value: $550,000 - $716,000
4
Beds
2
Baths
1,950
Sq Ft
$310/Sq Ft
Est. Value
About This Home
This home is located at 4252 Lorrain St, Shingle Springs, CA 95682 and is currently estimated at $604,018, approximately $309 per square foot. 4252 Lorrain St is a home located in El Dorado County with nearby schools including Buckeye Elementary School, Camerado Springs Middle School, and Ponderosa High School.
Ownership History
Date
Name
Owned For
Owner Type
Purchase Details
Closed on
May 23, 2024
Sold by
Murray James L and Murray Victoria J
Bought by
Murray Family Trust and Murray
Current Estimated Value
Purchase Details
Closed on
Feb 28, 2005
Sold by
Murray James L and Murray Victoria J
Bought by
Murray James L and Murray Victoria J
Home Financials for this Owner
Home Financials are based on the most recent Mortgage that was taken out on this home.
Original Mortgage
$35,000
Interest Rate
5.66%
Mortgage Type
New Conventional
Purchase Details
Closed on
Oct 2, 2000
Sold by
Collier John and Collier Lora
Bought by
Wagner Victoria J and Murray James L
Home Financials for this Owner
Home Financials are based on the most recent Mortgage that was taken out on this home.
Original Mortgage
$184,000
Interest Rate
8.01%
Purchase Details
Closed on
Jul 23, 1997
Sold by
Collier John
Bought by
Collier John and Collier Lora
Create a Home Valuation Report for This Property
The Home Valuation Report is an in-depth analysis detailing your home's value as well as a comparison with similar homes in the area
Home Values in the Area
Average Home Value in this Area
Purchase History
| Date | Buyer | Sale Price | Title Company |
|---|---|---|---|
| Murray Family Trust | -- | None Listed On Document | |
| Murray Family Trust | -- | None Listed On Document | |
| Murray James L | -- | None Listed On Document | |
| Murray James L | -- | Placer Title Company | |
| Wagner Victoria J | $230,000 | Placer Title Company | |
| Collier John | -- | Placer Title Company |
Source: Public Records
Mortgage History
| Date | Status | Borrower | Loan Amount |
|---|---|---|---|
| Previous Owner | Murray James L | $35,000 | |
| Previous Owner | Wagner Victoria J | $184,000 |
Source: Public Records
Tax History Compared to Growth
Tax History
| Year | Tax Paid | Tax Assessment Tax Assessment Total Assessment is a certain percentage of the fair market value that is determined by local assessors to be the total taxable value of land and additions on the property. | Land | Improvement |
|---|---|---|---|---|
| 2025 | $1,841 | $346,543 | $112,997 | $233,546 |
| 2024 | $1,841 | $339,749 | $110,782 | $228,967 |
| 2023 | $1,862 | $333,088 | $108,610 | $224,478 |
| 2022 | $1,918 | $326,558 | $106,481 | $220,077 |
| 2021 | $1,887 | $320,156 | $104,394 | $215,762 |
| 2020 | $1,891 | $316,874 | $103,324 | $213,550 |
| 2019 | $1,873 | $310,662 | $101,299 | $209,363 |
| 2018 | $1,843 | $304,571 | $99,313 | $205,258 |
| 2017 | $1,821 | $298,600 | $97,366 | $201,234 |
| 2016 | $1,800 | $292,746 | $95,457 | $197,289 |
| 2015 | $3,058 | $288,351 | $94,024 | $194,327 |
| 2014 | $3,058 | $282,704 | $92,183 | $190,521 |
Source: Public Records
Map
Nearby Homes
- 4285 Clare Dr
- 4290 Idle Creek Dr
- 4706 Hillwood Dr
- 4370 Hillwood Dr
- 4231 Idle Creek Dr
- 4500 French Creek Rd
- 4570 Woodside Way
- 4413 Vega Loop
- 2 S Shingle Rd
- 4461 Sunnyside Dr
- 0 El Caminito Rd
- 4569 Fewsville Ln
- 4101 Panadero Dr
- 2.49 AC Quest Ct
- 4600 El Caminito Rd
- 24-acres Business Dr
- 0 Product Dr Unit 225043756
- 0 Product Dr Unit 225043752
- 0 Product Dr Unit 202500060
- 0 Product Dr Unit 225003899
- 4248 Lorrain St
- 4256 Lorrain St
- 4261 Mithril Way
- 4247 Lorrain St
- 4262 Lorrain St
- 4251 Lorrain St
- 4257 Lorrain St
- 4270 Lorrain St
- 4265 Lorrain St
- 4261 Postoak Dr
- 4280 Lorrain St
- 4375 Creekside Dr
- 4241 Postoak Dr
- 4277 Lorrain St
- 4282 Roberta Ln
- 4286 Lorrain St
- 4261 Mac Ln
- 4272 Roberta Ln
- 4285 Lorrain St
- 4110 Creekside Dr