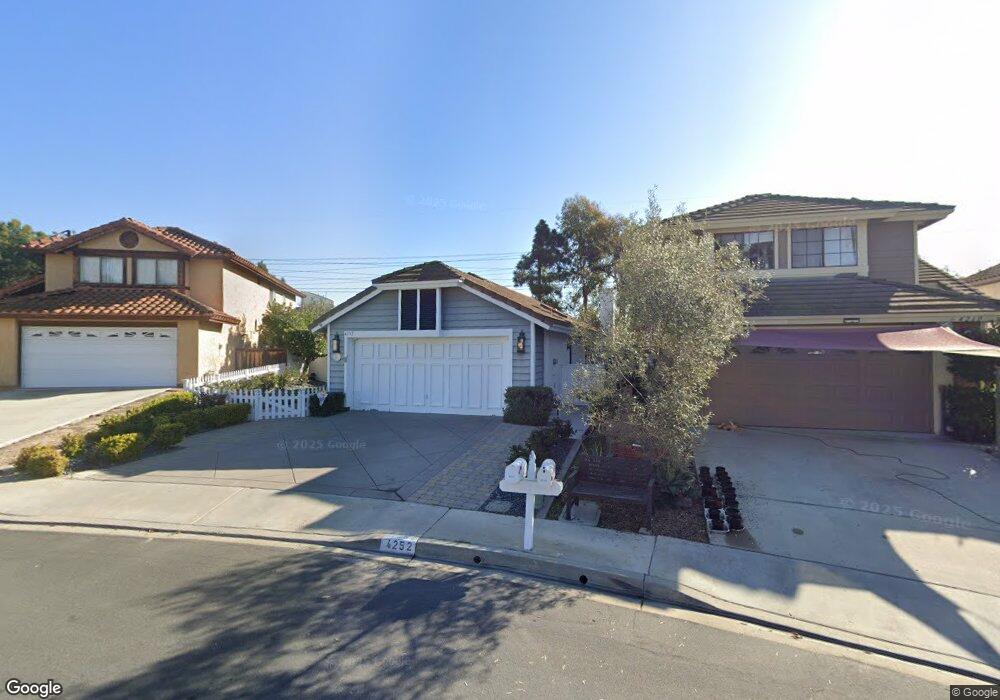
4252 Mancilla Ct San Diego, CA 92130
Carmel Valley NeighborhoodEstimated Value: $1,479,000 - $1,841,000
3
Beds
2
Baths
1,456
Sq Ft
$1,097/Sq Ft
Est. Value
About This Home
This home is located at 4252 Mancilla Ct, San Diego, CA 92130 and is currently estimated at $1,597,499, approximately $1,097 per square foot. 4252 Mancilla Ct is a home located in San Diego County with nearby schools including Carmel Del Mar Elementary School, Carmel Valley Middle School, and Torrey Pines High School.
Ownership History
Date
Name
Owned For
Owner Type
Purchase Details
Closed on
Nov 25, 2012
Sold by
Hayes Patrick Sean and Hayes Kristine Marie
Bought by
Hayes Patrick Sean and Hayes Kristine Marie
Current Estimated Value
Purchase Details
Closed on
May 28, 1998
Sold by
John Lucaccioni
Bought by
Hayes Patrick Seau and Hayes Kristine Marie
Home Financials for this Owner
Home Financials are based on the most recent Mortgage that was taken out on this home.
Original Mortgage
$224,000
Outstanding Balance
$45,046
Interest Rate
7.11%
Estimated Equity
$1,552,453
Purchase Details
Closed on
Jul 5, 1996
Sold by
John Luccacioni
Bought by
Lucaccioni John
Purchase Details
Closed on
Aug 19, 1994
Sold by
Feaver Clifford George and Feaver Cynthia Ann
Bought by
Luccacioni John
Purchase Details
Closed on
Sep 30, 1988
Purchase Details
Closed on
Jun 27, 1986
Create a Home Valuation Report for This Property
The Home Valuation Report is an in-depth analysis detailing your home's value as well as a comparison with similar homes in the area
Home Values in the Area
Average Home Value in this Area
Purchase History
| Date | Buyer | Sale Price | Title Company |
|---|---|---|---|
| Hayes Patrick Sean | -- | None Available | |
| Hayes Patrick Seau | $280,000 | Stewart Title | |
| Lucaccioni John | -- | -- | |
| Luccacioni John | $219,000 | Gateway Title Company | |
| -- | $230,000 | -- | |
| -- | $148,900 | -- |
Source: Public Records
Mortgage History
| Date | Status | Borrower | Loan Amount |
|---|---|---|---|
| Open | Hayes Patrick Seau | $224,000 | |
| Closed | Hayes Patrick Seau | $28,000 |
Source: Public Records
Tax History Compared to Growth
Tax History
| Year | Tax Paid | Tax Assessment Tax Assessment Total Assessment is a certain percentage of the fair market value that is determined by local assessors to be the total taxable value of land and additions on the property. | Land | Improvement |
|---|---|---|---|---|
| 2025 | $5,584 | $515,479 | $204,137 | $311,342 |
| 2024 | $5,584 | $505,373 | $200,135 | $305,238 |
| 2023 | $5,454 | $495,464 | $196,211 | $299,253 |
| 2022 | $5,349 | $485,750 | $192,364 | $293,386 |
| 2021 | $5,158 | $476,227 | $188,593 | $287,634 |
| 2020 | $5,201 | $471,345 | $186,660 | $284,685 |
| 2019 | $5,102 | $462,103 | $183,000 | $279,103 |
| 2018 | $4,884 | $453,043 | $179,412 | $273,631 |
| 2017 | $81 | $444,161 | $175,895 | $268,266 |
| 2016 | $4,641 | $435,453 | $172,447 | $263,006 |
| 2015 | $4,573 | $428,913 | $169,857 | $259,056 |
| 2014 | $4,482 | $420,512 | $166,530 | $253,982 |
Source: Public Records
Map
Nearby Homes
- 12518 Cavallo St
- 4615 Da Vinci St
- 4042 Moratalla Terrace
- 12372 Carmel Country Rd Unit 202
- 12370 Carmel Country Rd Unit 202
- 12372 Carmel Country Rd Unit 207
- 12368 Carmel Country Rd Unit 303
- 4436 Heritage Glen Ln
- 3965 Via Holgura
- 3975 San Gregorio Way
- 12364 Carmel Country Rd Unit C306
- 3718 Mykonos Ln Unit 158
- 12936 Carmel Creek Rd Unit 63
- 3877 Pell Place Unit 108
- 4049 Carmel View Rd Unit 75
- 4049 Carmel View Rd Unit 74
- 4065 Carmel View Rd Unit 24
- 5049 Ruette de Mer
- 12585 Ruette Alliante Unit 152
- 12221 Caminito Mira Del Mar
- 4260 Mancilla Ct
- 4244 Mancilla Ct
- 4268 Mancilla Ct
- 4236 Mancilla Ct
- 4276 Mancilla Ct
- 4228 Mancilla Ct
- 4227 Mancilla Ct
- 4284 Mancilla Ct
- 4220 Mancilla Ct
- 4219 Mancilla Ct
- 4212 Mancilla Ct
- 4292 Mancilla Ct
- 12685 Portada Place
- 12531 Manifesto Place
- 12693 Portada Place
- 4211 Mancilla Ct
- 12677 Portada Place
- 4204 Mancilla Ct
- 12669 Portada Place
- 12523 Manifesto Place