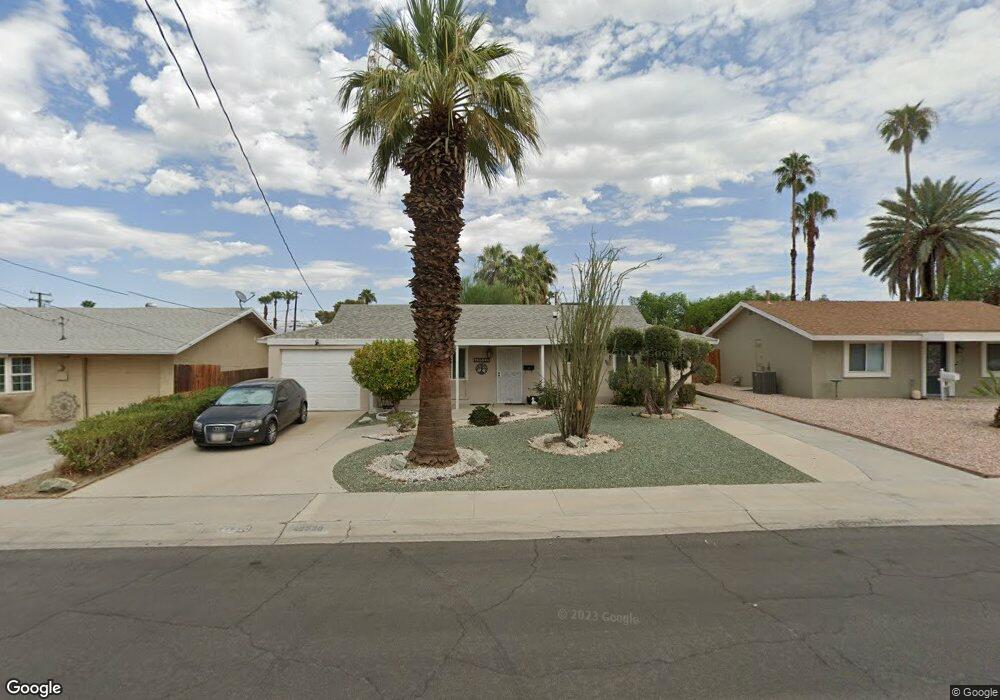
42520 Kansas St Palm Desert, CA 92211
Estimated Value: $302,000 - $406,000
2
Beds
2
Baths
1,064
Sq Ft
$332/Sq Ft
Est. Value
About This Home
This home is located at 42520 Kansas St, Palm Desert, CA 92211 and is currently estimated at $352,975, approximately $331 per square foot. 42520 Kansas St is a home located in Riverside County with nearby schools including Gerald R. Ford Elementary School, Colonel Mitchell Paige Middle School, and Palm Desert High School.
Ownership History
Date
Name
Owned For
Owner Type
Purchase Details
Closed on
Jun 6, 2018
Sold by
Kelly Kathleen G O and Schaeffer Nancy J
Bought by
Kelly Kathleen G O and Schaefer Nancy J
Current Estimated Value
Purchase Details
Closed on
May 7, 2018
Sold by
Graham Judith S and Ingram Lenore S M
Bought by
Okelly Kathleen G and Schaeffer Nancy J
Purchase Details
Closed on
Apr 4, 2017
Sold by
Graham Judith S and Ingram Lenore S M
Bought by
Graham Judith S and Ingram Lenore S M
Purchase Details
Closed on
Sep 8, 2015
Sold by
Hunter Marianne and Downey Rebecca J
Bought by
Hunter Marianne and Downey Rebecca J
Purchase Details
Closed on
Oct 28, 2013
Sold by
Kinnaird Kathleen S and Matuizek Deborah A
Bought by
Graham Judith S and Ingram Lenore S M
Purchase Details
Closed on
Jun 25, 2001
Sold by
Bertrand Lewis T
Bought by
Kinnaird Kathleen S and Graham Judith S
Create a Home Valuation Report for This Property
The Home Valuation Report is an in-depth analysis detailing your home's value as well as a comparison with similar homes in the area
Home Values in the Area
Average Home Value in this Area
Purchase History
| Date | Buyer | Sale Price | Title Company |
|---|---|---|---|
| Kelly Kathleen G O | -- | None Available | |
| Okelly Kathleen G | -- | None Available | |
| Graham Judith S | $73,518 | None Available | |
| Hunter Marianne | -- | None Available | |
| Graham Judith S | $52,000 | Orange Coast Title Co | |
| Kinnaird Kathleen S | $105,000 | Chicago Title Co |
Source: Public Records
Tax History Compared to Growth
Tax History
| Year | Tax Paid | Tax Assessment Tax Assessment Total Assessment is a certain percentage of the fair market value that is determined by local assessors to be the total taxable value of land and additions on the property. | Land | Improvement |
|---|---|---|---|---|
| 2025 | $3,457 | $230,586 | $74,378 | $156,208 |
| 2023 | $3,346 | $221,635 | $71,491 | $150,144 |
| 2022 | $3,244 | $217,290 | $70,090 | $147,200 |
| 2021 | $3,164 | $213,030 | $68,716 | $144,314 |
| 2020 | $3,113 | $210,847 | $68,012 | $142,835 |
| 2019 | $3,059 | $206,714 | $66,679 | $140,035 |
| 2018 | $2,663 | $174,414 | $52,694 | $121,720 |
| 2017 | $2,432 | $156,228 | $52,480 | $103,748 |
| 2016 | $2,383 | $153,165 | $51,451 | $101,714 |
| 2015 | $2,373 | $150,866 | $50,679 | $100,187 |
| 2014 | $2,224 | $147,912 | $49,687 | $98,225 |
Source: Public Records
Map
Nearby Homes
- 42440 Kansas St
- 42660 Iowa St
- 42660 Wisconsin Ave
- 77190 Minnesota Ave
- 42700 Wisconsin Ave
- 42405 Turqueries Ave
- 77265 California Dr
- 42265 Wisconsin Ave
- 76948 Scimitar Way
- 42725 Turqueries Ave
- 76914 Scimitar Way
- 43000 Connecticut St
- 77178 Pauma Valley Way
- 76895 Morocco Rd
- 77050 Pauma Valley Way
- 76849 Maresh Ct
- 42706 Liolios Dr
- 77380 Minnesota Ave
- 42320 Sari Ct
- 41934 Preston Trail
- 42500 Kansas St
- 42540 Kansas St
- 42525 Iowa St
- 42505 Iowa St
- 42545 Iowa St
- 42480 Kansas St
- 42560 Kansas St
- 42485 Iowa St
- 42565 Iowa St
- 42525 Kansas St
- 42505 Kansas St
- 42460 Kansas St
- 42580 Kansas St
- 42545 Kansas St
- 42495 Kansas St
- 42465 Iowa St
- 42585 Iowa St
- 42565 Kansas St
- 42475 Kansas St
- 42600 Kansas St