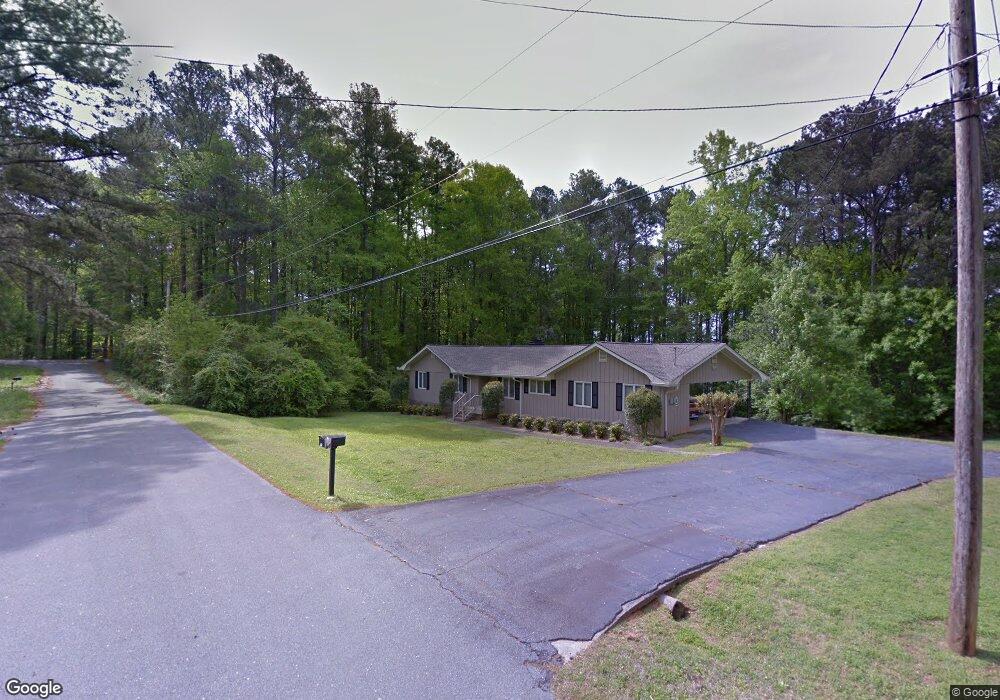
4253 Lakeview St Acworth, GA 30101
Estimated Value: $389,000 - $490,000
3
Beds
2
Baths
1,838
Sq Ft
$228/Sq Ft
Est. Value
About This Home
This home is located at 4253 Lakeview St, Acworth, GA 30101 and is currently estimated at $419,347, approximately $228 per square foot. 4253 Lakeview St is a home located in Cobb County with nearby schools including McCall Primary School, Acworth Intermediate School, and Barber Middle School.
Ownership History
Date
Name
Owned For
Owner Type
Purchase Details
Closed on
Jun 3, 2024
Sold by
Schisler Mark
Bought by
Schisler Ashley Anne
Current Estimated Value
Home Financials for this Owner
Home Financials are based on the most recent Mortgage that was taken out on this home.
Original Mortgage
$338,999
Outstanding Balance
$334,796
Interest Rate
7.17%
Mortgage Type
New Conventional
Estimated Equity
$84,551
Purchase Details
Closed on
Jun 20, 2022
Sold by
Hackenberg Virginia M
Bought by
Schisler Mark
Home Financials for this Owner
Home Financials are based on the most recent Mortgage that was taken out on this home.
Original Mortgage
$380,000
Interest Rate
4.48%
Mortgage Type
New Conventional
Purchase Details
Closed on
Jun 21, 2014
Sold by
Schisler George M
Bought by
Schieler Family Tr
Create a Home Valuation Report for This Property
The Home Valuation Report is an in-depth analysis detailing your home's value as well as a comparison with similar homes in the area
Home Values in the Area
Average Home Value in this Area
Purchase History
| Date | Buyer | Sale Price | Title Company |
|---|---|---|---|
| Schisler Ashley Anne | $340,100 | None Listed On Document | |
| Schisler Ashley Anne | $340,100 | None Listed On Document | |
| Schisler Mark | $380,000 | Bowling Law Llc | |
| Schieler Family Tr | -- | -- |
Source: Public Records
Mortgage History
| Date | Status | Borrower | Loan Amount |
|---|---|---|---|
| Open | Schisler Ashley Anne | $338,999 | |
| Closed | Schisler Ashley Anne | $338,999 | |
| Previous Owner | Schisler Mark | $380,000 |
Source: Public Records
Tax History Compared to Growth
Tax History
| Year | Tax Paid | Tax Assessment Tax Assessment Total Assessment is a certain percentage of the fair market value that is determined by local assessors to be the total taxable value of land and additions on the property. | Land | Improvement |
|---|---|---|---|---|
| 2024 | $5,698 | $188,972 | $102,808 | $86,164 |
| 2023 | $4,611 | $152,932 | $77,108 | $75,824 |
| 2022 | $4,410 | $145,308 | $69,484 | $75,824 |
| 2021 | $3,450 | $113,672 | $54,144 | $59,528 |
| 2020 | $4,314 | $109,160 | $49,632 | $59,528 |
| 2019 | $3,313 | $109,160 | $49,632 | $59,528 |
| 2018 | $2,815 | $92,736 | $45,120 | $47,616 |
| 2017 | $2,666 | $92,736 | $45,120 | $47,616 |
| 2016 | $2,407 | $83,712 | $36,096 | $47,616 |
| 2015 | $1,631 | $55,368 | $21,056 | $34,312 |
| 2014 | $1,645 | $55,368 | $0 | $0 |
Source: Public Records
Map
Nearby Homes
- 3125 Lakeview St
- 4254 Lakeview St
- 4269 Lakeview St
- 4242 Lakeview St
- 4266 Lakeview St
- 0 Lakeview St Unit 7104357
- 4412 Lakeview Ct
- 4419 Lakeview Ct
- 4400 Lakeview Ct
- 4279 Lakeview St
- 4278 Lakeview St
- 4286 Maple Dr
- 4249 Brenda Dr
- 4239 Brenda Dr
- 4304 Maple Dr
- 4288 Lakeview St
- 4367 Maple Dr
- 4291 Lakeview St
- 4277 Maple Dr
- 0 Brenda Dr