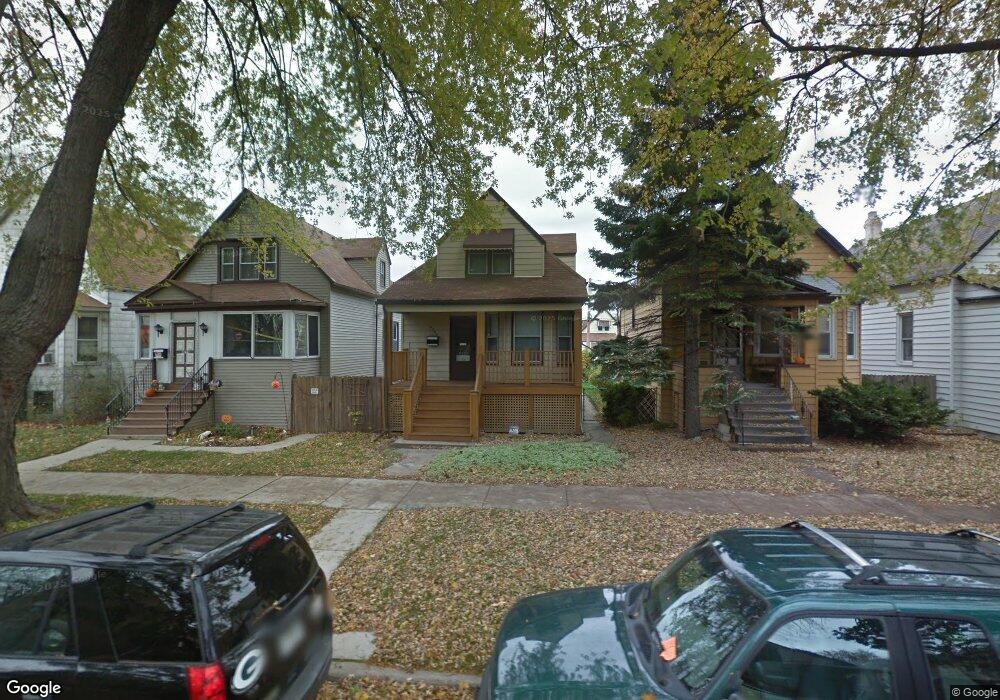
4253 N Monticello Ave Chicago, IL 60618
Irving Park NeighborhoodEstimated Value: $481,000 - $708,000
3
Beds
1
Bath
1,234
Sq Ft
$446/Sq Ft
Est. Value
About This Home
This home is located at 4253 N Monticello Ave, Chicago, IL 60618 and is currently estimated at $550,364, approximately $446 per square foot. 4253 N Monticello Ave is a home located in Cook County with nearby schools including Henry Elementary School, Roosevelt High School, and ASPIRA Haugan Middle School.
Ownership History
Date
Name
Owned For
Owner Type
Purchase Details
Closed on
Apr 10, 2003
Sold by
Dimond Barbara A and Zeman Barbara A
Bought by
Lump Ronald P
Current Estimated Value
Home Financials for this Owner
Home Financials are based on the most recent Mortgage that was taken out on this home.
Original Mortgage
$258,400
Outstanding Balance
$111,903
Interest Rate
5.86%
Estimated Equity
$438,461
Purchase Details
Closed on
Feb 4, 1994
Sold by
Zeman Barbara A
Bought by
Zeman Barbara A
Home Financials for this Owner
Home Financials are based on the most recent Mortgage that was taken out on this home.
Original Mortgage
$94,000
Interest Rate
7.31%
Purchase Details
Closed on
Dec 13, 1993
Sold by
Zeman Barbara A
Bought by
Zeman Barbara A
Home Financials for this Owner
Home Financials are based on the most recent Mortgage that was taken out on this home.
Original Mortgage
$94,000
Interest Rate
7.31%
Purchase Details
Closed on
Oct 7, 1993
Sold by
Zeman Barbara A
Bought by
Zeman Barbara A and Barbara A Zeman Living Trust
Create a Home Valuation Report for This Property
The Home Valuation Report is an in-depth analysis detailing your home's value as well as a comparison with similar homes in the area
Home Values in the Area
Average Home Value in this Area
Purchase History
| Date | Buyer | Sale Price | Title Company |
|---|---|---|---|
| Lump Ronald P | $323,000 | Atgf Inc | |
| Lump Ronald P | $323,000 | Atgf Inc | |
| Zeman Barbara A | -- | Lenders Title Guaranty | |
| Zeman Barbara A | -- | Lenders Title Guaranty | |
| Zeman Barbara A | -- | -- |
Source: Public Records
Mortgage History
| Date | Status | Borrower | Loan Amount |
|---|---|---|---|
| Open | Lump Ronald P | $258,400 | |
| Closed | Lump Ronald P | $258,400 | |
| Previous Owner | Zeman Barbara A | $94,000 | |
| Closed | Lump Ronald P | $32,300 |
Source: Public Records
Tax History Compared to Growth
Tax History
| Year | Tax Paid | Tax Assessment Tax Assessment Total Assessment is a certain percentage of the fair market value that is determined by local assessors to be the total taxable value of land and additions on the property. | Land | Improvement |
|---|---|---|---|---|
| 2024 | $7,109 | $39,000 | $19,999 | $19,001 |
| 2023 | $6,908 | $36,890 | $18,750 | $18,140 |
| 2022 | $6,908 | $36,890 | $18,750 | $18,140 |
| 2021 | $6,771 | $36,889 | $18,750 | $18,139 |
| 2020 | $5,065 | $25,761 | $8,250 | $17,511 |
| 2019 | $5,079 | $28,624 | $8,250 | $20,374 |
| 2018 | $4,992 | $28,624 | $8,250 | $20,374 |
| 2017 | $5,129 | $27,121 | $7,500 | $19,621 |
| 2016 | $5,370 | $29,220 | $7,500 | $21,720 |
| 2015 | $4,891 | $29,220 | $7,500 | $21,720 |
| 2014 | $4,179 | $25,008 | $6,750 | $18,258 |
| 2013 | $4,085 | $25,008 | $6,750 | $18,258 |
Source: Public Records
Map
Nearby Homes
- 3707 W Cullom Ave Unit 1
- 3611 W Montrose Ave Unit 405
- 3550 W Montrose Ave Unit 107
- 4207 N Drake Ave
- 4135 N Monticello Ave
- 4203 N Drake Ave
- 4426 N Drake Ave
- 4115 N Ridgeway Ave
- 4103 N Lawndale Ave Unit 202
- 4207 N Avers Ave
- 3816 W Montrose Ave
- 3558 W Belle Plaine Ave Unit 3
- 3734 W Sunnyside Ave
- 3551 W Belle Plaine Ave Unit 2
- 4246 N Kimball Ave
- 4322 N Kimball Ave
- 4419 N Bernard St
- 4155 N Bernard St Unit G
- 4515 N Hamlin Ave
- 4534 N Saint Louis Ave
- 4255 N Monticello Ave
- 4255 N Monticello Ave
- 4249 N Monticello Ave
- 4247 N Monticello Ave
- 4243 N Monticello Ave
- 4241 N Monticello Ave
- 3603 W Cullom Ave Unit 2W
- 3603 W Cullom Ave Unit 1
- 4254 N Central Park Ave
- 4248 N Central Park Ave
- 4237 N Monticello Ave
- 4244 N Central Park Ave
- 3618 W Cullom Ave
- 4252 N Central Park Ave
- 4252 N Central Park Ave Unit 1
- 4242 N Central Park Ave
- 4254 N Monticello Ave
- 3601 W Cullom Ave Unit 2
- 3601 W Cullom Ave Unit 1E
- 3601 W Cullom Ave