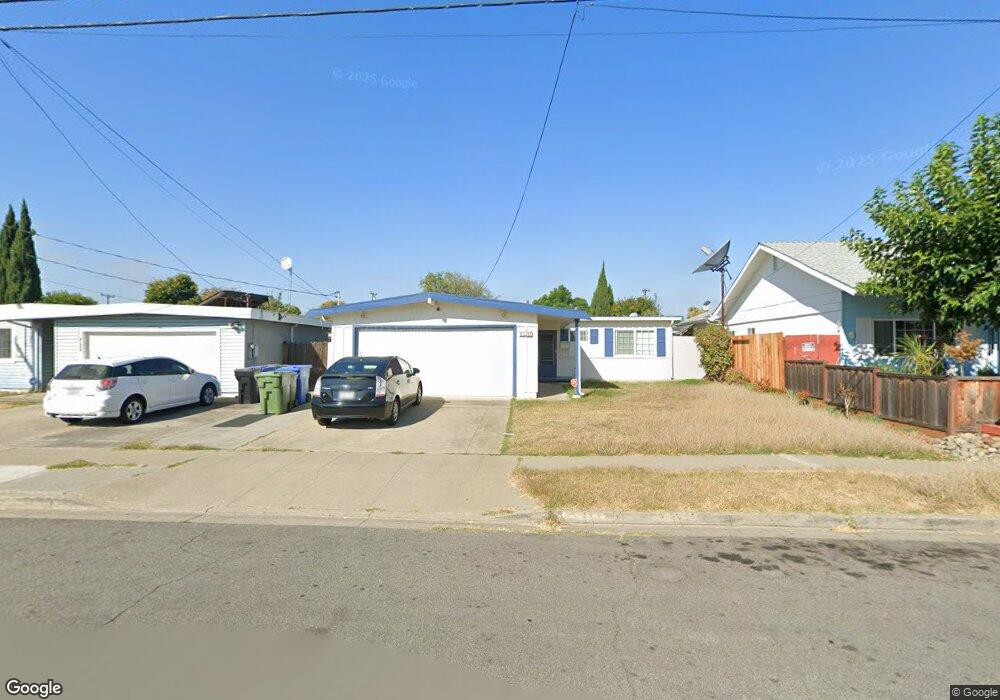
42541 Charleston Way Fremont, CA 94538
Grimmer NeighborhoodEstimated Value: $866,000 - $1,319,000
3
Beds
1
Bath
1,000
Sq Ft
$1,140/Sq Ft
Est. Value
About This Home
This home is located at 42541 Charleston Way, Fremont, CA 94538 and is currently estimated at $1,139,675, approximately $1,139 per square foot. 42541 Charleston Way is a home located in Alameda County with nearby schools including E. M. Grimmer Elementary School, John M. Horner Junior High School, and Irvington High School.
Ownership History
Date
Name
Owned For
Owner Type
Purchase Details
Closed on
Dec 27, 2011
Sold by
Lopez Piedad
Bought by
Wang Yan Zhe
Current Estimated Value
Home Financials for this Owner
Home Financials are based on the most recent Mortgage that was taken out on this home.
Original Mortgage
$225,000
Outstanding Balance
$153,736
Interest Rate
3.91%
Mortgage Type
New Conventional
Estimated Equity
$985,939
Purchase Details
Closed on
Oct 10, 2006
Sold by
Deguzman Reynold V and De Guzman Marissa A
Bought by
Lopez Piedad
Home Financials for this Owner
Home Financials are based on the most recent Mortgage that was taken out on this home.
Original Mortgage
$452,800
Interest Rate
8.25%
Mortgage Type
Negative Amortization
Purchase Details
Closed on
Dec 12, 1995
Sold by
Lampe John A and Lampe Sandra M
Bought by
Deguzman Reynold V and Deguzman Marissa A
Home Financials for this Owner
Home Financials are based on the most recent Mortgage that was taken out on this home.
Original Mortgage
$168,300
Interest Rate
7.38%
Mortgage Type
Assumption
Create a Home Valuation Report for This Property
The Home Valuation Report is an in-depth analysis detailing your home's value as well as a comparison with similar homes in the area
Home Values in the Area
Average Home Value in this Area
Purchase History
| Date | Buyer | Sale Price | Title Company |
|---|---|---|---|
| Wang Yan Zhe | $300,000 | Fidelity National Title Co | |
| Lopez Piedad | $566,000 | Alliance Title Company | |
| Deguzman Reynold V | $168,500 | Placer Title Company |
Source: Public Records
Mortgage History
| Date | Status | Borrower | Loan Amount |
|---|---|---|---|
| Open | Wang Yan Zhe | $225,000 | |
| Previous Owner | Lopez Piedad | $452,800 | |
| Previous Owner | Deguzman Reynold V | $168,300 |
Source: Public Records
Tax History Compared to Growth
Tax History
| Year | Tax Paid | Tax Assessment Tax Assessment Total Assessment is a certain percentage of the fair market value that is determined by local assessors to be the total taxable value of land and additions on the property. | Land | Improvement |
|---|---|---|---|---|
| 2025 | $5,011 | $376,796 | $150,718 | $226,078 |
| 2024 | $5,011 | $369,410 | $147,764 | $221,646 |
| 2023 | $4,866 | $362,168 | $144,867 | $217,301 |
| 2022 | $4,786 | $355,067 | $142,027 | $213,040 |
| 2021 | $4,674 | $348,107 | $139,243 | $208,864 |
| 2020 | $4,629 | $344,540 | $137,816 | $206,724 |
| 2019 | $4,580 | $337,787 | $135,115 | $202,672 |
| 2018 | $4,489 | $331,166 | $132,466 | $198,700 |
| 2017 | $4,378 | $324,675 | $129,870 | $194,805 |
| 2016 | $4,295 | $318,308 | $127,323 | $190,985 |
| 2015 | $4,230 | $313,530 | $125,412 | $188,118 |
| 2014 | $4,152 | $307,388 | $122,955 | $184,433 |
Source: Public Records
Map
Nearby Homes
- 42759 Newport Dr
- 3872 Wildflower Common Unit 27
- 3923 Wildflower Common Unit 19
- 42111 Osgood Rd Unit 523
- 4309 Bora Ave
- 3918 Fossano Common
- 43270 Newport Dr
- 3800 Adams Ave
- 42747 Wixon Dr
- 41212 Fremont Blvd
- 262 Manitoba Green
- 4533 Capewood Terrace
- 4537 Capewood Terrace
- 261 Manitoba Green Unit 261
- 257 Manitoba Green
- 3757 Savannah Rd
- 307 Winnipeg Green
- 208 Manitoba Terrace
- 3730 Savannah Rd
- 3207 Washington Blvd
- 42529 Charleston Way
- 42553 Charleston Way
- 42540 Roberts Ave
- 42565 Charleston Way
- 42552 Roberts Ave
- 42528 Roberts Ave
- 3768 Franklin Ave
- 3780 Franklin Ave
- 42564 Roberts Ave
- 42542 Charleston Way
- 42530 Charleston Way
- 42619 Charleston Way
- 42554 Charleston Way
- 42516 Roberts Ave
- 42518 Charleston Way
- 42618 Roberts Ave
- 42566 Charleston Way
- 42631 Charleston Way
- 3732 Franklin Ave
- 42630 Roberts Ave