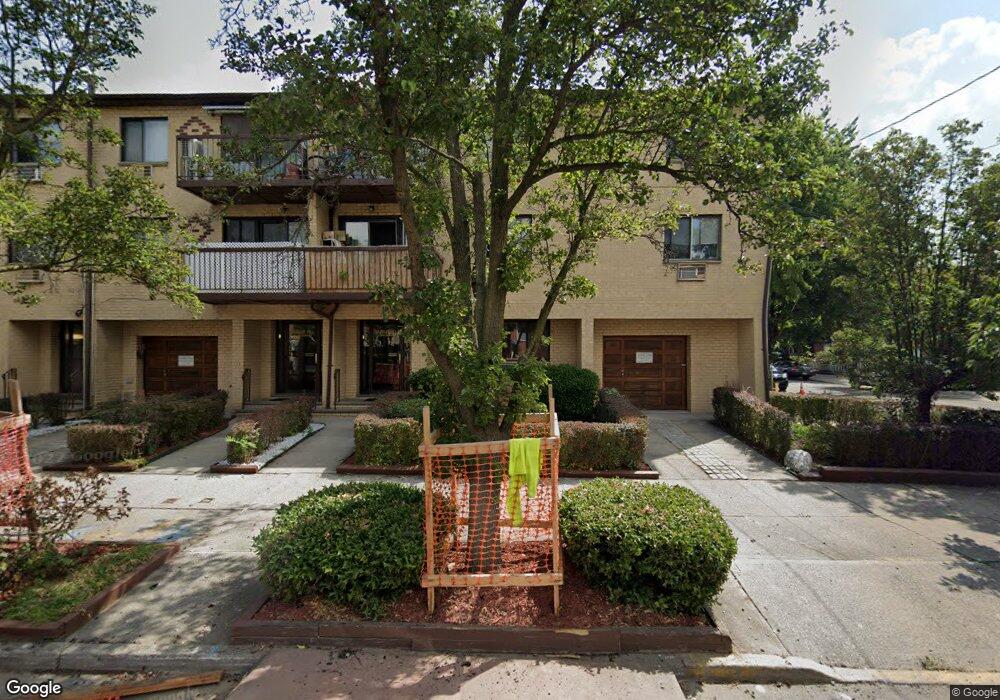
4255 159th St Unit 1A Flushing, NY 11358
East Flushing NeighborhoodEstimated Value: $527,995 - $638,000
Studio
--
Bath
1,462
Sq Ft
$401/Sq Ft
Est. Value
About This Home
This home is located at 4255 159th St Unit 1A, Flushing, NY 11358 and is currently estimated at $585,749, approximately $400 per square foot. 4255 159th St Unit 1A is a home located in Queens County with nearby schools including P.S. 22 - Thomas Jefferson, I.S. 25 Adrien Block, and Francis Lewis High School.
Ownership History
Date
Name
Owned For
Owner Type
Purchase Details
Closed on
Aug 1, 2025
Sold by
Hardecker Irene and Montreuil Larry
Bought by
Lawrence J Montreuil Revocable Living T
Current Estimated Value
Create a Home Valuation Report for This Property
The Home Valuation Report is an in-depth analysis detailing your home's value as well as a comparison with similar homes in the area
Home Values in the Area
Average Home Value in this Area
Purchase History
| Date | Buyer | Sale Price | Title Company |
|---|---|---|---|
| Lawrence J Montreuil Revocable Living T | -- | -- |
Source: Public Records
Tax History
| Year | Tax Paid | Tax Assessment Tax Assessment Total Assessment is a certain percentage of the fair market value that is determined by local assessors to be the total taxable value of land and additions on the property. | Land | Improvement |
|---|---|---|---|---|
| 2025 | $5,218 | $43,320 | $5,994 | $37,326 |
| 2024 | $5,218 | $41,737 | $5,994 | $35,743 |
| 2018 | $5,114 | $42,533 | $5,994 | $36,539 |
| 2017 | $4,914 | $40,357 | $5,994 | $34,363 |
| 2016 | $4,614 | $40,357 | $5,994 | $34,363 |
| 2015 | $3,102 | $36,431 | $5,994 | $30,437 |
| 2014 | $3,102 | $33,849 | $5,994 | $27,855 |
Source: Public Records
Map
Nearby Homes
- 42-28 159th St
- 4304 158th St Unit Lobby 4
- 42-20 158th St
- 4344 161st St
- 4260 157th St Unit 3D
- 16001 Sanford Ave
- 42-16 162nd St
- 16003 Sanford Ave
- 4363 160th St
- 43-27 162nd St
- 43-23 156th St
- 42-36 156th St
- 43-58 163rd St
- 43-33 163rd St
- 15517 Sanford Ave Unit 2E
- 155-17 Sanford Ave Unit 6D
- 155-17 Sanford Ave Unit 6A
- 155-17 Sanford Ave Unit 2F
- 154-21 Ash Ave
- 163-02 45th Ave
- 4255 159th St Unit 2A
- 4255 159th St Unit 3A
- 4255 159th St Unit 3B
- 4255 159th St Unit 3A
- 4255 159th St Unit 2B
- 4255 159th St Unit 2A
- 4255 159th St Unit 3Fl
- 4255 159th St
- 4255 159th St Unit 2B
- 4255 159th St Unit 3Fl
- 4255 159th St Unit 2R
- 4255 159th St Unit 2B
- 4255 159th St
- 4255 159th St Unit GAR4
- 4255 159th St Unit 2A
- 4255 159th St Unit 3A
- 4253 159th St Unit 3B
- 4253 159th St Unit 3A
- 4253 159th St Unit 2B
- 4253 159th St Unit 2A
Your Personal Tour Guide
Ask me questions while you tour the home.