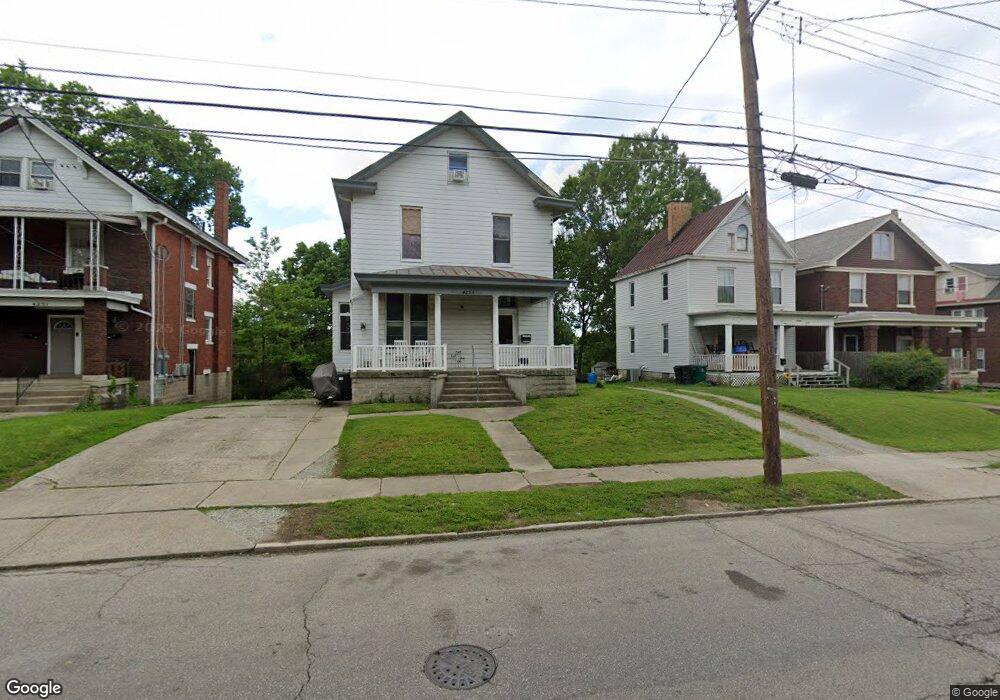
4255 W 8th St Cincinnati, OH 45205
West Price Hill NeighborhoodEstimated Value: $171,000 - $207,019
4
Beds
2
Baths
1,853
Sq Ft
$102/Sq Ft
Est. Value
About This Home
This home is located at 4255 W 8th St, Cincinnati, OH 45205 and is currently estimated at $189,005, approximately $101 per square foot. 4255 W 8th St is a home located in Hamilton County with nearby schools including Carson School, Gilbert A. Dater High School, and Western Hills High School.
Ownership History
Date
Name
Owned For
Owner Type
Purchase Details
Closed on
May 2, 2024
Sold by
Kinne Mark F and Kinne Lauren M
Bought by
Price Joshua
Current Estimated Value
Home Financials for this Owner
Home Financials are based on the most recent Mortgage that was taken out on this home.
Original Mortgage
$179,685
Outstanding Balance
$177,122
Interest Rate
6.79%
Mortgage Type
FHA
Estimated Equity
$11,883
Purchase Details
Closed on
Apr 22, 2024
Sold by
Kinne Christina M and Klepper Christina M
Bought by
Kinne Mark F
Home Financials for this Owner
Home Financials are based on the most recent Mortgage that was taken out on this home.
Original Mortgage
$179,685
Outstanding Balance
$177,122
Interest Rate
6.79%
Mortgage Type
FHA
Estimated Equity
$11,883
Purchase Details
Closed on
Sep 6, 2023
Sold by
Klapper Christina M
Bought by
Line Mark F
Purchase Details
Closed on
Nov 6, 2015
Sold by
Schenkel Scott A
Bought by
Kinne Mark F and Kinne Christian M
Home Financials for this Owner
Home Financials are based on the most recent Mortgage that was taken out on this home.
Original Mortgage
$123,717
Interest Rate
3.5%
Mortgage Type
FHA
Create a Home Valuation Report for This Property
The Home Valuation Report is an in-depth analysis detailing your home's value as well as a comparison with similar homes in the area
Home Values in the Area
Average Home Value in this Area
Purchase History
| Date | Buyer | Sale Price | Title Company |
|---|---|---|---|
| Price Joshua | $183,000 | Chicago Title | |
| Kinne Mark F | -- | None Listed On Document | |
| Line Mark F | -- | None Listed On Document | |
| Kinne Mark F | -- | Attorney |
Source: Public Records
Mortgage History
| Date | Status | Borrower | Loan Amount |
|---|---|---|---|
| Open | Price Joshua | $179,685 | |
| Previous Owner | Kinne Mark F | $123,717 |
Source: Public Records
Tax History Compared to Growth
Tax History
| Year | Tax Paid | Tax Assessment Tax Assessment Total Assessment is a certain percentage of the fair market value that is determined by local assessors to be the total taxable value of land and additions on the property. | Land | Improvement |
|---|---|---|---|---|
| 2024 | $3,115 | $52,010 | $5,866 | $46,144 |
| 2023 | $3,186 | $52,010 | $5,866 | $46,144 |
| 2022 | $3,311 | $48,511 | $5,828 | $42,683 |
| 2021 | $3,185 | $48,511 | $5,828 | $42,683 |
| 2020 | $3,278 | $48,511 | $5,828 | $42,683 |
| 2019 | $3,257 | $44,100 | $5,299 | $38,801 |
| 2018 | $3,262 | $44,100 | $5,299 | $38,801 |
| 2017 | $3,098 | $44,100 | $5,299 | $38,801 |
| 2016 | $1,685 | $23,577 | $5,660 | $17,917 |
| 2015 | $1,520 | $23,577 | $5,660 | $17,917 |
| 2014 | $1,530 | $23,577 | $5,660 | $17,917 |
| 2013 | $1,767 | $26,793 | $6,433 | $20,360 |
Source: Public Records
Map
Nearby Homes
- 4247 Eighth St W
- 700 Trenton Ave
- 900 Kreis Ln
- 4260 Delridge Dr
- 617 Trenton Ave
- 4330 Schulte Dr
- 1006 Kreis Ln
- 4300 Foley Rd
- 1026 Schiff Ave
- 4419 Ridgeview Ave
- 4526 Clearview Ave
- 4136 Saint Lawrence Ave
- 4549 Clearview Ave
- 4041 W 8th St
- 4553 Clearview Ave
- 1002 Winfield Ave
- 4226 Skylark Dr
- 904 Rosemont Ave
- 4082 Mardon Place
- 4309 Westhaven Ave
- 4255 Eighth St W
- 4259 W 8th St
- 4251 W 8th St
- 4251 Eighth St W
- 4259 Eighth St W
- 4247 Eighth St W
- 4261 W 8th St
- 4261 Eighth St W
- 4247 W 8th St
- 4302 W 8th St
- 4263 W 8th St
- 4263 W 8th St Unit 4265
- 4248 Loubell Ln
- 4250 Loubell Ln
- 4243 W 8th St
- 4265 W 8th St
- 4243 Eighth St W
- 4244 Loubell Ln Unit 1
- 4244 Loubell Ln Unit 4
- 4244 Loubell Ln