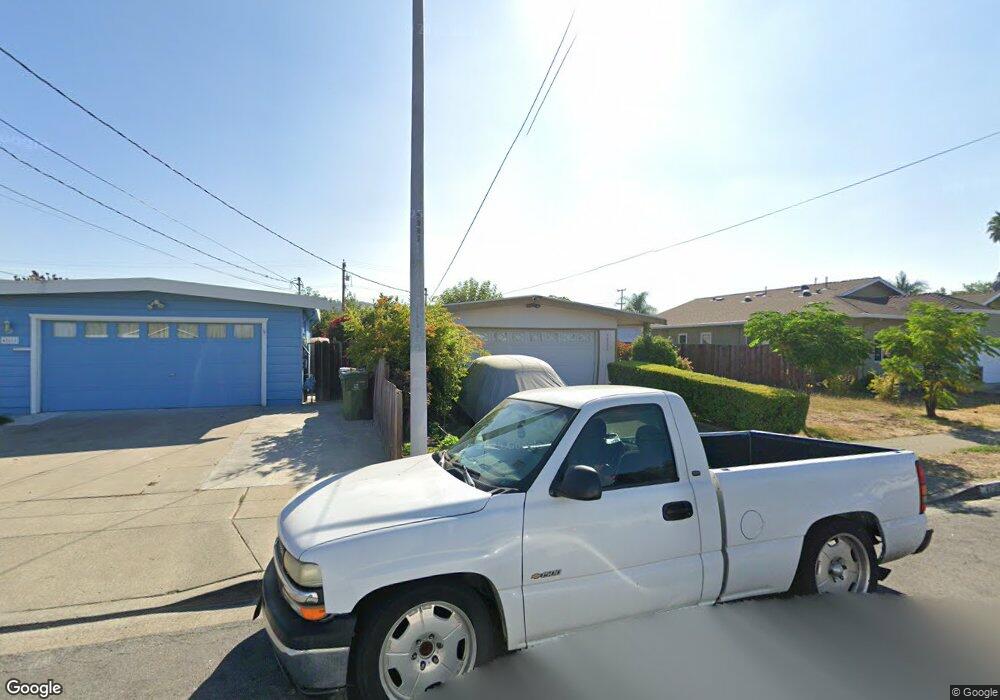
42566 Charleston Way Fremont, CA 94538
Grimmer NeighborhoodEstimated Value: $1,144,000 - $1,332,000
3
Beds
1
Bath
1,000
Sq Ft
$1,256/Sq Ft
Est. Value
About This Home
This home is located at 42566 Charleston Way, Fremont, CA 94538 and is currently estimated at $1,256,379, approximately $1,256 per square foot. 42566 Charleston Way is a home located in Alameda County with nearby schools including E. M. Grimmer Elementary School, John M. Horner Junior High School, and Irvington High School.
Ownership History
Date
Name
Owned For
Owner Type
Purchase Details
Closed on
Oct 16, 2009
Sold by
Lim David Guang Yao
Bought by
Xue Sammy Yue Nong
Current Estimated Value
Home Financials for this Owner
Home Financials are based on the most recent Mortgage that was taken out on this home.
Original Mortgage
$142,000
Outstanding Balance
$92,582
Interest Rate
5.05%
Mortgage Type
New Conventional
Estimated Equity
$1,163,797
Purchase Details
Closed on
Oct 15, 2009
Sold by
Sweesy Kathy and Marilyn Castenada Revocable Tr
Bought by
Nong Xue Genqiang and Nong Xue Sammy Yue
Home Financials for this Owner
Home Financials are based on the most recent Mortgage that was taken out on this home.
Original Mortgage
$142,000
Outstanding Balance
$92,582
Interest Rate
5.05%
Mortgage Type
New Conventional
Estimated Equity
$1,163,797
Purchase Details
Closed on
Mar 27, 2006
Sold by
Castenada Marilyn
Bought by
Castenada Marilyn and Marilyn Castenada Revocable Tr
Purchase Details
Closed on
May 13, 2004
Sold by
Castenada Joe
Bought by
Castenada Joe and Castenada Marilyn
Create a Home Valuation Report for This Property
The Home Valuation Report is an in-depth analysis detailing your home's value as well as a comparison with similar homes in the area
Home Values in the Area
Average Home Value in this Area
Purchase History
| Date | Buyer | Sale Price | Title Company |
|---|---|---|---|
| Xue Sammy Yue Nong | -- | Fidelity National Title | |
| Nong Xue Genqiang | $342,000 | Fidelity National Title | |
| Castenada Marilyn | -- | None Available | |
| Castenada Joe | -- | -- |
Source: Public Records
Mortgage History
| Date | Status | Borrower | Loan Amount |
|---|---|---|---|
| Open | Nong Xue Genqiang | $142,000 |
Source: Public Records
Tax History Compared to Growth
Tax History
| Year | Tax Paid | Tax Assessment Tax Assessment Total Assessment is a certain percentage of the fair market value that is determined by local assessors to be the total taxable value of land and additions on the property. | Land | Improvement |
|---|---|---|---|---|
| 2025 | $5,729 | $441,428 | $132,428 | $309,000 |
| 2024 | $5,729 | $432,776 | $129,833 | $302,943 |
| 2023 | $5,566 | $424,291 | $127,287 | $297,004 |
| 2022 | $5,479 | $415,974 | $124,792 | $291,182 |
| 2021 | $5,350 | $407,820 | $122,346 | $285,474 |
| 2020 | $5,315 | $403,641 | $121,092 | $282,549 |
| 2019 | $5,258 | $395,727 | $118,718 | $277,009 |
| 2018 | $5,154 | $387,971 | $116,391 | $271,580 |
| 2017 | $5,027 | $380,364 | $114,109 | $266,255 |
| 2016 | $4,934 | $372,908 | $111,872 | $261,036 |
| 2015 | $4,862 | $367,310 | $110,193 | $257,117 |
| 2014 | $4,773 | $360,118 | $108,035 | $252,083 |
Source: Public Records
Map
Nearby Homes
- 42759 Newport Dr
- 3872 Wildflower Common Unit 27
- 3923 Wildflower Common Unit 19
- 42111 Osgood Rd Unit 523
- 4309 Bora Ave
- 43270 Newport Dr
- 3918 Fossano Common
- 3800 Adams Ave
- 42747 Wixon Dr
- 41212 Fremont Blvd
- 262 Manitoba Green
- 261 Manitoba Green Unit 261
- 257 Manitoba Green
- 3757 Savannah Rd
- 307 Winnipeg Green
- 4533 Capewood Terrace
- 4537 Capewood Terrace
- 2561 Middlefield Ave
- 208 Manitoba Terrace
- 3730 Savannah Rd
- 42632 Charleston Way
- 42554 Charleston Way
- 42633 Newport Dr
- 42644 Charleston Way
- 42542 Charleston Way
- 42621 Newport Dr
- 42645 Newport Dr
- 42609 Newport Dr
- 42657 Newport Dr
- 42619 Charleston Way
- 42565 Charleston Way
- 42656 Charleston Way
- 42530 Charleston Way
- 42631 Charleston Way
- 42553 Charleston Way
- 42669 Newport Dr
- 42579 Newport Dr
- 42643 Charleston Way
- 42541 Charleston Way
- 42668 Charleston Way