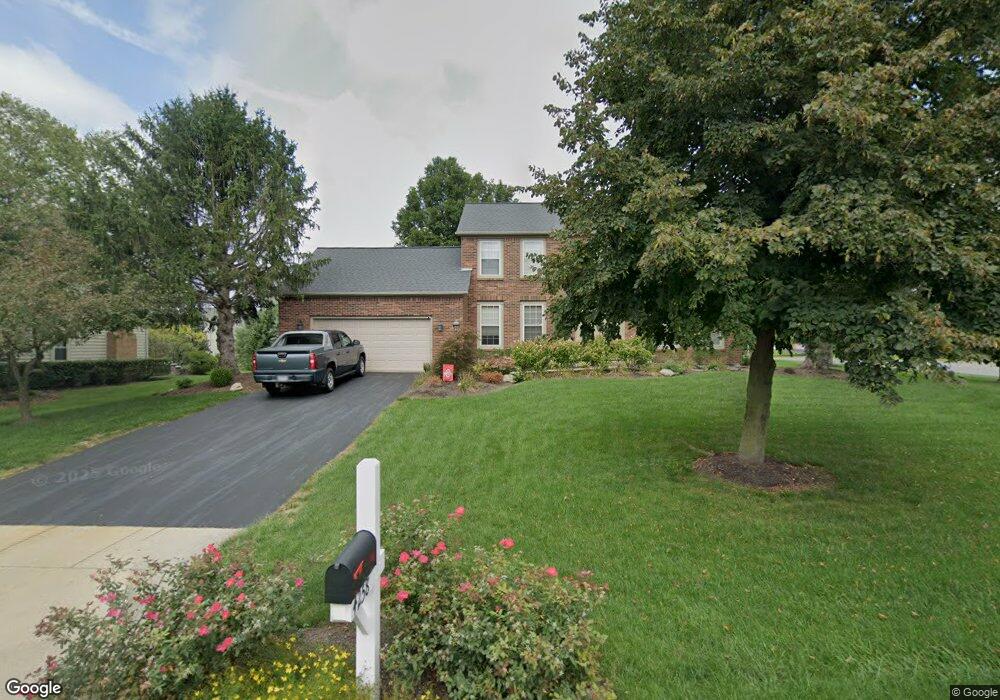
4258 Ewing Ct Powell, OH 43065
Estimated Value: $561,000 - $593,000
4
Beds
3
Baths
2,521
Sq Ft
$229/Sq Ft
Est. Value
About This Home
This home is located at 4258 Ewing Ct, Powell, OH 43065 and is currently estimated at $576,144, approximately $228 per square foot. 4258 Ewing Ct is a home located in Delaware County with nearby schools including Scioto Ridge Elementary School, Olentangy Liberty Middle School, and Olentangy Liberty High School.
Ownership History
Date
Name
Owned For
Owner Type
Purchase Details
Closed on
Mar 29, 2024
Sold by
Evans Todd M
Bought by
Todd M Evans Revocable Trust and Evans
Current Estimated Value
Purchase Details
Closed on
Mar 30, 2017
Bought by
Todd M Evans
Home Financials for this Owner
Home Financials are based on the most recent Mortgage that was taken out on this home.
Original Mortgage
$125,000
Interest Rate
4.14%
Purchase Details
Closed on
Feb 27, 1998
Sold by
Dominion Homes Inc
Bought by
Evans Todd M and Evans Tammy A
Home Financials for this Owner
Home Financials are based on the most recent Mortgage that was taken out on this home.
Original Mortgage
$202,450
Interest Rate
6.95%
Mortgage Type
New Conventional
Purchase Details
Closed on
May 8, 1997
Sold by
Penn Traffic Co
Bought by
Borror Corp
Create a Home Valuation Report for This Property
The Home Valuation Report is an in-depth analysis detailing your home's value as well as a comparison with similar homes in the area
Home Values in the Area
Average Home Value in this Area
Purchase History
| Date | Buyer | Sale Price | Title Company |
|---|---|---|---|
| Todd M Evans Revocable Trust | -- | None Listed On Document | |
| Todd M Evans | $285,600 | -- | |
| Evans Todd M | $225,008 | -- | |
| Borror Corp | $36,900 | -- |
Source: Public Records
Mortgage History
| Date | Status | Borrower | Loan Amount |
|---|---|---|---|
| Previous Owner | Todd M Evans | $125,000 | |
| Previous Owner | Todd M Evans | -- | |
| Previous Owner | Todd M Evans | -- | |
| Previous Owner | Evans Todd M | $202,450 |
Source: Public Records
Tax History
| Year | Tax Paid | Tax Assessment Tax Assessment Total Assessment is a certain percentage of the fair market value that is determined by local assessors to be the total taxable value of land and additions on the property. | Land | Improvement |
|---|---|---|---|---|
| 2024 | $8,364 | $159,640 | $37,630 | $122,010 |
| 2023 | $8,397 | $159,640 | $37,630 | $122,010 |
| 2022 | $7,804 | $117,640 | $24,500 | $93,140 |
| 2021 | $7,055 | $117,640 | $24,500 | $93,140 |
| 2020 | $7,890 | $117,640 | $24,500 | $93,140 |
| 2019 | $7,125 | $110,740 | $24,500 | $86,240 |
| 2018 | $7,158 | $110,740 | $24,500 | $86,240 |
| 2017 | $6,651 | $99,960 | $20,160 | $79,800 |
| 2016 | $6,877 | $99,960 | $20,160 | $79,800 |
| 2015 | $6,219 | $99,960 | $20,160 | $79,800 |
| 2014 | $6,305 | $99,960 | $20,160 | $79,800 |
| 2013 | $6,302 | $97,650 | $20,160 | $77,490 |
Source: Public Records
Map
Nearby Homes
- 4445 Tavistock Cir
- 9430 Wilbrook Dr
- 3899 Hampshire Ave
- 9821 Oxford Cir
- 3722 Hampshire Ave
- 9978 Lavenham Cir W
- 10010 Beckford Ct
- 9375 Creighton Dr
- 4470 Bobwhite Trace
- 3881 Orchard Way
- 3839 Orchard Way
- 3991 Orchard View Place
- 9427 Clermont Cir Unit 9427
- 9023 Samari Place
- 3638 Foresta Grand Dr
- 3697 Stoneway Point Unit 83697
- 3702 Stoneway Point
- 0 Bunker Ln
- 9196 McDowall Dr
- 11 Murphys View Place
- 9594 Ireland Ct
- 4292 Ewing Ct
- 4214 Mack Ct
- 4263 Ewing Ct
- 9589 Wayne Brown Dr
- 9586 Ireland Ct
- 4303 Ewing Ct
- 4312 Ewing Ct
- 4190 Mack Ct
- 4190 Mack Ct Unit 2330
- 9575 Wayne Brown Dr
- 9605 Ireland Ct
- 9591 Ireland Ct
- 9576 Ireland Ct
- 4195 Mack Ct
- 4323 Ewing Ct
- 9588 Wayne Brown Dr
- 4176 Mack Ct
- 9571 Ireland Ct
- 4326 Ewing Ct
Your Personal Tour Guide
Ask me questions while you tour the home.