42586 Lilley Pointe Dr Unit 6 Canton, MI 48187
Estimated Value: $197,813 - $218,000
Studio
2
Baths
1,028
Sq Ft
$200/Sq Ft
Est. Value
About This Home
This home is located at 42586 Lilley Pointe Dr Unit 6, Canton, MI 48187 and is currently estimated at $205,453, approximately $199 per square foot. 42586 Lilley Pointe Dr Unit 6 is a home located in Wayne County with nearby schools including Canton High School, Discovery Middle School, and Salem High School.
Ownership History
Date
Name
Owned For
Owner Type
Purchase Details
Closed on
Sep 18, 2023
Sold by
Opendoor Property J Llc
Bought by
Nannapaneni Vijaya L
Current Estimated Value
Purchase Details
Closed on
Jun 21, 2023
Sold by
Aganathan Vinoth and Aganathan Christina
Bought by
Opendoor Property J Llc
Purchase Details
Closed on
Sep 23, 2019
Sold by
Aganathan Vinoth
Bought by
Aganathan Vinoth and Aganathan Vinoth Christine
Home Financials for this Owner
Home Financials are based on the most recent Mortgage that was taken out on this home.
Original Mortgage
$85,000
Interest Rate
3.5%
Mortgage Type
New Conventional
Purchase Details
Closed on
Feb 24, 2017
Sold by
Magureanu Maria C
Bought by
Aganthan Vinoth
Purchase Details
Closed on
Feb 19, 2015
Sold by
Magureanu Maria C and Rodriquez Fernando
Bought by
Magureanu Maria C
Purchase Details
Closed on
Jan 19, 2004
Sold by
Kupkowsky Sandra L
Bought by
Rodriguez Fernando
Purchase Details
Closed on
Nov 30, 2001
Sold by
Goff Carie R
Bought by
Kupkowsky Sandra L
Create a Home Valuation Report for This Property
The Home Valuation Report is an in-depth analysis detailing your home's value as well as a comparison with similar homes in the area
Home Values in the Area
Average Home Value in this Area
Purchase History
| Date | Buyer | Sale Price | Title Company |
|---|---|---|---|
| Nannapaneni Vijaya L | $200,000 | None Listed On Document | |
| Nannapaneni Vijaya L | $200,000 | None Listed On Document | |
| Opendoor Property J Llc | $164,100 | None Listed On Document | |
| Aganathan Vinoth | -- | None Available | |
| Aganthan Vinoth | $98,000 | None Available | |
| Magureanu Maria C | -- | None Available | |
| Rodriguez Fernando | $124,900 | Multiple | |
| Kupkowsky Sandra L | $125,000 | -- |
Source: Public Records
Mortgage History
| Date | Status | Borrower | Loan Amount |
|---|---|---|---|
| Previous Owner | Aganathan Vinoth | $85,000 |
Source: Public Records
Tax History
| Year | Tax Paid | Tax Assessment Tax Assessment Total Assessment is a certain percentage of the fair market value that is determined by local assessors to be the total taxable value of land and additions on the property. | Land | Improvement |
|---|---|---|---|---|
| 2025 | $2,705 | $81,600 | $0 | $0 |
| 2024 | $2,626 | $72,500 | $0 | $0 |
| 2023 | $937 | $67,300 | $0 | $0 |
| 2022 | $2,143 | $57,600 | $0 | $0 |
| 2021 | $2,080 | $55,600 | $0 | $0 |
| 2020 | $2,051 | $53,000 | $0 | $0 |
| 2019 | $2,017 | $48,410 | $0 | $0 |
| 2018 | $796 | $45,200 | $0 | $0 |
| 2017 | $1,411 | $40,400 | $0 | $0 |
| 2016 | $1,174 | $40,900 | $0 | $0 |
| 2015 | $2,641 | $35,790 | $0 | $0 |
| 2013 | $2,559 | $26,740 | $0 | $0 |
| 2010 | -- | $36,190 | $18,000 | $18,190 |
Source: Public Records
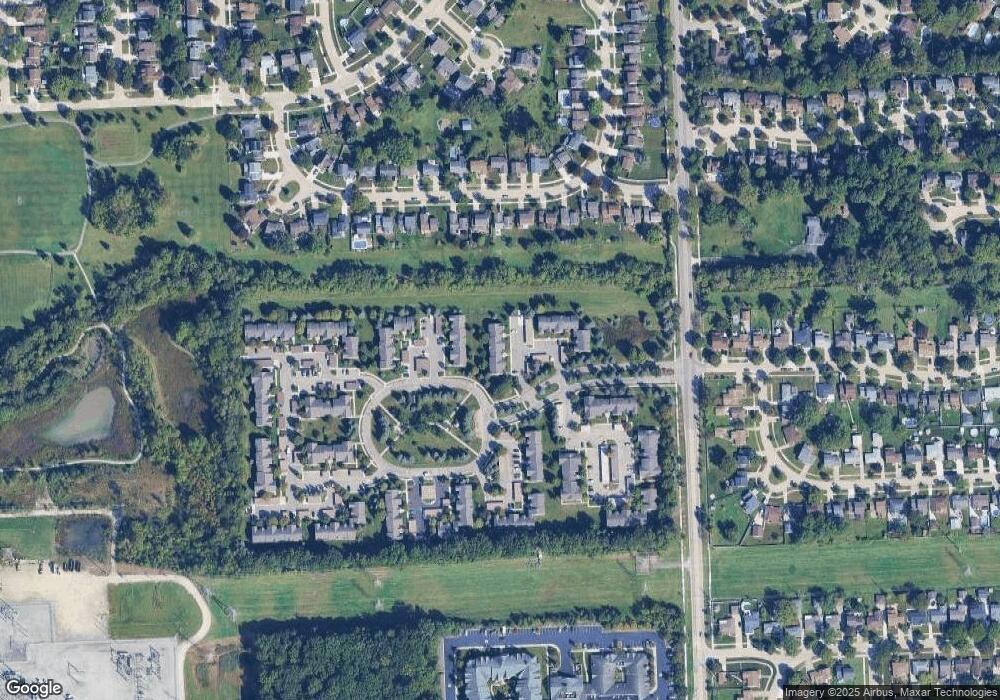
Map
Nearby Homes
- 42714 Lilley Pointe Dr Unit 213
- 42739 Lilley Pointe Dr Unit 119
- 42789 Lilley Pointe Dr Unit 146
- 42745 Redfern St
- 42216 Metaline Dr
- 42195 Briarcliff Ct
- 1399 Copeland Cir
- 1680 Manton Blvd
- 41772 Glade Rd Unit 41
- 43818 Palisades Dr
- 41777 Princess Dr
- 41260 Maplewood Dr Unit 5
- 41160 Maplewood Dr Unit 15
- 41210 Maplewood Dr Unit 10
- 446 Cherry Stone Dr Unit 54
- 41587 Pheasant Creek Dr
- 1399 Elmhurst St
- 1211 W Franciscan Ct
- 321 Cherry Grove Rd
- 5794 Willow Creek Dr
- 42580 Lilley Pointe Dr
- 42580 Lilley Pointe Dr Unit 70
- 42580 Lilley Pointe Dr
- 42582 Lilley Pointe Dr Unit 67
- 42584 Lilley Pointe Dr Unit 68
- 42586 Lilley Pointe Dr Unit 65
- 42588 Lilley Pointe Dr Unit 66
- 42590 Lilley Pointe Dr Unit 63
- 42592 Lilley Pointe Dr Unit 64
- 42592 Lilley Pointe Dr Unit 6, 64
- 42594 Lilley Pointe Dr Unit 6 61
- 42594 Lilley Pointe Dr Unit 61
- 42596 Lilley Pointe Dr Unit 62
- 42596 Lilley Pointe Dr
- 42686 Lilley Pointe Dr
- 42688 Lilley Pointe Dr
- 42682 Lilley Pointe Dr Unit 221
- 42684 Lilley Pointe Dr Unit 222
- 42582 Lilley Pointe Dr
- 42680 Lilley Pointe Dr Unit 224
Your Personal Tour Guide
Ask me questions while you tour the home.