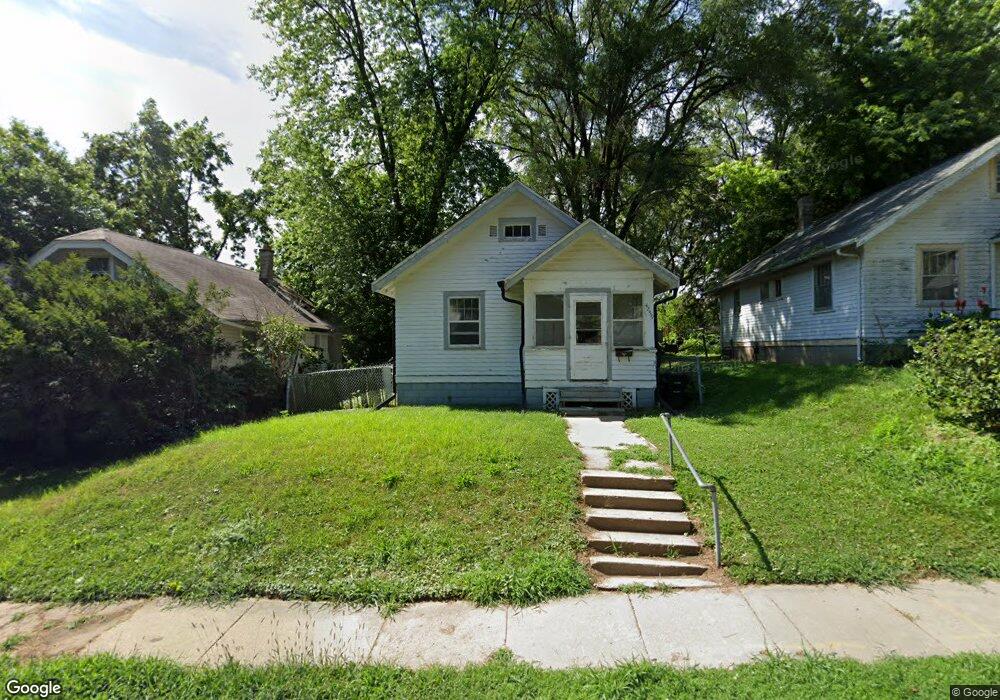
4259 Maple St Omaha, NE 68111
Clifton Hills NeighborhoodEstimated Value: $110,000 - $130,000
3
Beds
1
Bath
864
Sq Ft
$137/Sq Ft
Est. Value
About This Home
This home is located at 4259 Maple St, Omaha, NE 68111 and is currently estimated at $118,334, approximately $136 per square foot. 4259 Maple St is a home located in Douglas County with nearby schools including King Elementary School, Monroe Middle School, and Benson Magnet High School.
Ownership History
Date
Name
Owned For
Owner Type
Purchase Details
Closed on
Jul 10, 2023
Sold by
Boevree Eileen C
Bought by
Jackat Holdings Llc
Current Estimated Value
Purchase Details
Closed on
Oct 6, 2010
Sold by
Smarter Choices Holding Company Llc
Bought by
Waytes Karen
Home Financials for this Owner
Home Financials are based on the most recent Mortgage that was taken out on this home.
Original Mortgage
$45,808
Interest Rate
5.25%
Mortgage Type
FHA
Purchase Details
Closed on
Apr 2, 2010
Sold by
American National Bank
Bought by
Smarter Choices Holding Company Llc
Purchase Details
Closed on
May 7, 2009
Sold by
Juloya Edelwina and Juloya Clyde
Bought by
American National Bank
Create a Home Valuation Report for This Property
The Home Valuation Report is an in-depth analysis detailing your home's value as well as a comparison with similar homes in the area
Home Values in the Area
Average Home Value in this Area
Purchase History
| Date | Buyer | Sale Price | Title Company |
|---|---|---|---|
| Jackat Holdings Llc | $28,000 | None Listed On Document | |
| Waytes Karen | $47,000 | None Available | |
| Smarter Choices Holding Company Llc | $18,000 | None Available | |
| American National Bank | $35,000 | None Available |
Source: Public Records
Mortgage History
| Date | Status | Borrower | Loan Amount |
|---|---|---|---|
| Previous Owner | Waytes Karen | $45,808 |
Source: Public Records
Tax History
| Year | Tax Paid | Tax Assessment Tax Assessment Total Assessment is a certain percentage of the fair market value that is determined by local assessors to be the total taxable value of land and additions on the property. | Land | Improvement |
|---|---|---|---|---|
| 2025 | $1,598 | $94,800 | $10,900 | $83,900 |
| 2024 | $1,536 | $94,800 | $10,900 | $83,900 |
| 2023 | $1,536 | $72,800 | $10,900 | $61,900 |
| 2022 | $1,554 | $72,800 | $10,900 | $61,900 |
| 2021 | $1,132 | $53,500 | $10,900 | $42,600 |
| 2020 | $1,145 | $53,500 | $10,900 | $42,600 |
| 2019 | $676 | $31,500 | $700 | $30,800 |
| 2018 | $836 | $38,900 | $700 | $38,200 |
| 2017 | $648 | $30,000 | $700 | $29,300 |
| 2016 | $534 | $24,900 | $600 | $24,300 |
Source: Public Records
Map
Nearby Homes
Your Personal Tour Guide
Ask me questions while you tour the home.