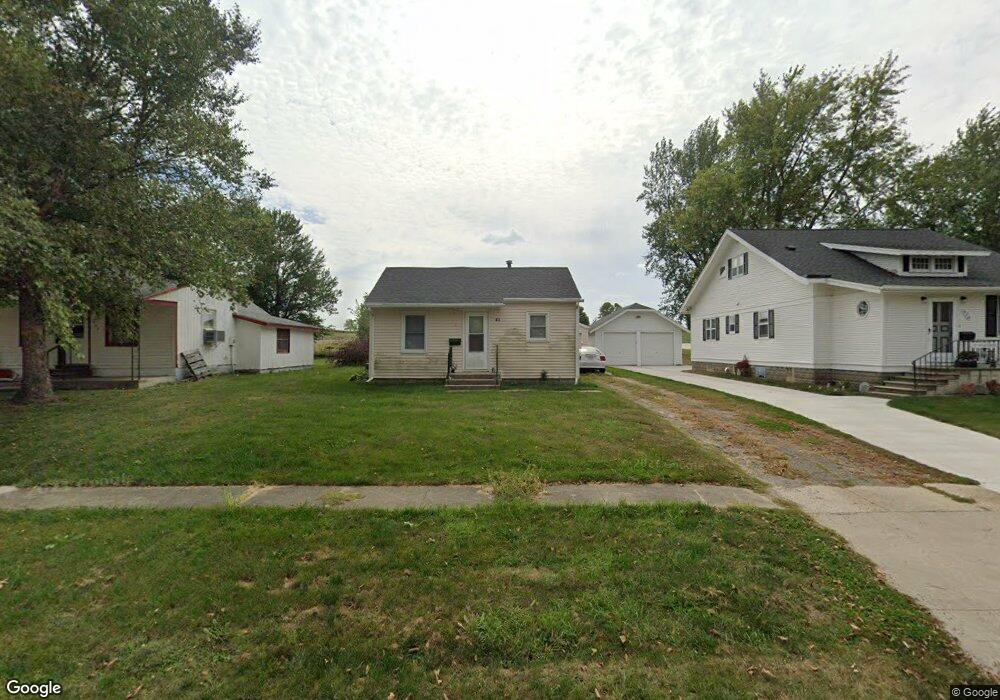
426 11th St Manning, IA 51455
Estimated Value: $59,000 - $106,000
1
Bed
1
Bath
840
Sq Ft
$97/Sq Ft
Est. Value
About This Home
This home is located at 426 11th St, Manning, IA 51455 and is currently estimated at $81,765, approximately $97 per square foot. 426 11th St is a home with nearby schools including Ikm-Manning High School, IKM-Manning Middle School, and Irwin Elementary School.
Ownership History
Date
Name
Owned For
Owner Type
Purchase Details
Closed on
Aug 1, 2019
Sold by
Bauer Jeffrey J
Bought by
Zamago-Vera Jose M
Current Estimated Value
Home Financials for this Owner
Home Financials are based on the most recent Mortgage that was taken out on this home.
Original Mortgage
$33,250
Outstanding Balance
$29,121
Interest Rate
3.7%
Mortgage Type
New Conventional
Estimated Equity
$52,644
Purchase Details
Closed on
Aug 22, 2016
Sold by
Curlile Wayne E and Curlile Velaine M
Bought by
Bauer Jeffrey J
Purchase Details
Closed on
Oct 23, 2013
Sold by
Curlile Wayne and Curlile Velaine
Bought by
Curlile Wayne E and Curlile Velaine M
Create a Home Valuation Report for This Property
The Home Valuation Report is an in-depth analysis detailing your home's value as well as a comparison with similar homes in the area
Purchase History
| Date | Buyer | Sale Price | Title Company |
|---|---|---|---|
| Zamago-Vera Jose M | $36,500 | -- | |
| Bauer Jeffrey J | $20,000 | None Available | |
| Curlile Wayne E | -- | None Available |
Source: Public Records
Mortgage History
| Date | Status | Borrower | Loan Amount |
|---|---|---|---|
| Open | Zamago-Vera Jose M | $33,250 |
Source: Public Records
Tax History
| Year | Tax Paid | Tax Assessment Tax Assessment Total Assessment is a certain percentage of the fair market value that is determined by local assessors to be the total taxable value of land and additions on the property. | Land | Improvement |
|---|---|---|---|---|
| 2025 | $754 | $59,730 | $8,580 | $51,150 |
| 2024 | $7 | $51,230 | $8,580 | $42,650 |
| 2023 | $750 | $51,230 | $8,580 | $42,650 |
| 2022 | $738 | $44,940 | $7,350 | $37,590 |
| 2021 | $738 | $44,940 | $7,350 | $37,590 |
| 2020 | $752 | $44,940 | $7,350 | $37,590 |
| 2019 | $734 | $42,320 | $0 | $0 |
| 2018 | $702 | $44,940 | $7,350 | $37,590 |
| 2017 | $702 | $42,318 | $5,767 | $36,551 |
| 2016 | $656 | $39,550 | $0 | $0 |
| 2015 | $656 | $38,170 | $0 | $0 |
| 2014 | $638 | $38,170 | $0 | $0 |
Source: Public Records
Map
Nearby Homes
Your Personal Tour Guide
Ask me questions while you tour the home.