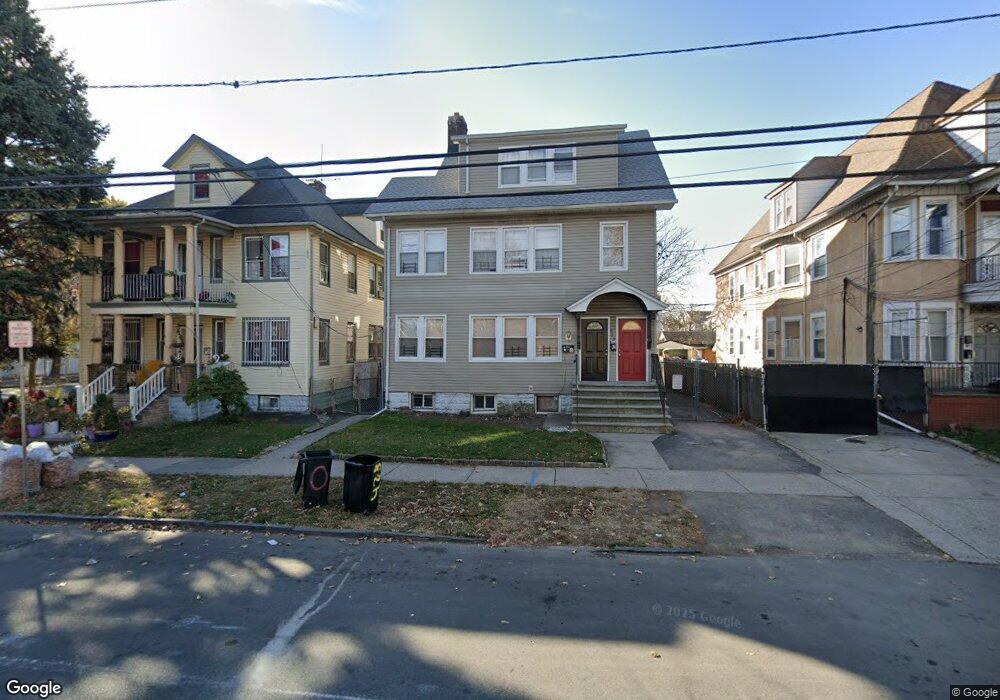
426 3rd Ave W Unit 2 Newark, NJ 07107
Lower Roseville NeighborhoodEstimated Value: $731,000 - $780,000
--
Bed
--
Bath
2,847
Sq Ft
$266/Sq Ft
Est. Value
About This Home
This home is located at 426 3rd Ave W Unit 2, Newark, NJ 07107 and is currently estimated at $758,445, approximately $266 per square foot. 426 3rd Ave W Unit 2 is a home located in Essex County with nearby schools including Dr. William H. Horton School, First Avenue Elementary School, and Franklin School.
Ownership History
Date
Name
Owned For
Owner Type
Purchase Details
Closed on
Oct 4, 2024
Sold by
Hinds Brian and Adeyemi Habib O
Bought by
Zhangallimbay Angel Salvador Sum
Current Estimated Value
Home Financials for this Owner
Home Financials are based on the most recent Mortgage that was taken out on this home.
Original Mortgage
$588,000
Outstanding Balance
$580,274
Interest Rate
6.08%
Mortgage Type
New Conventional
Estimated Equity
$178,171
Purchase Details
Closed on
Jul 17, 2012
Sold by
Deleon Andrea
Bought by
Hinds Brian and Adeyemi Habib O
Home Financials for this Owner
Home Financials are based on the most recent Mortgage that was taken out on this home.
Original Mortgage
$277,775
Interest Rate
3.7%
Mortgage Type
FHA
Purchase Details
Closed on
Nov 8, 2011
Sold by
Barrett Noel
Bought by
Deleon Andrea
Create a Home Valuation Report for This Property
The Home Valuation Report is an in-depth analysis detailing your home's value as well as a comparison with similar homes in the area
Home Values in the Area
Average Home Value in this Area
Purchase History
| Date | Buyer | Sale Price | Title Company |
|---|---|---|---|
| Zhangallimbay Angel Salvador Sum | $775,000 | Stewart Title | |
| Hinds Brian | $285,000 | None Available | |
| Deleon Andrea | $130,000 | Chicago Title | |
| Deleon Andrea | $130,000 | Chicago Title Insurance Co | |
| Deleon Andrea | $130,000 | Chicago Title |
Source: Public Records
Mortgage History
| Date | Status | Borrower | Loan Amount |
|---|---|---|---|
| Open | Zhangallimbay Angel Salvador Sum | $588,000 | |
| Previous Owner | Hinds Brian | $277,775 |
Source: Public Records
Tax History Compared to Growth
Tax History
| Year | Tax Paid | Tax Assessment Tax Assessment Total Assessment is a certain percentage of the fair market value that is determined by local assessors to be the total taxable value of land and additions on the property. | Land | Improvement |
|---|---|---|---|---|
| 2025 | $9,365 | $251,200 | $48,800 | $202,400 |
| 2024 | $9,365 | $251,200 | $48,800 | $202,400 |
| 2022 | $9,385 | $251,200 | $48,800 | $202,400 |
| 2021 | $9,380 | $251,200 | $48,800 | $202,400 |
| 2020 | $9,546 | $251,200 | $48,800 | $202,400 |
| 2019 | $9,448 | $251,200 | $48,800 | $202,400 |
| 2018 | $9,277 | $251,200 | $48,800 | $202,400 |
| 2017 | $8,943 | $251,200 | $48,800 | $202,400 |
| 2016 | $8,641 | $251,200 | $48,800 | $202,400 |
| 2015 | $8,312 | $251,200 | $48,800 | $202,400 |
| 2014 | $7,790 | $251,200 | $48,800 | $202,400 |
Source: Public Records
Map
Nearby Homes
- 226 N 9th St
- 382-384 N 7th St
- 457 N 7th St
- 372 N 7th St
- 352 N 7th St
- 504-506 N 7th St
- 504 N 7th St Unit 506
- 277 2nd Ave W Unit 2
- 277 2nd Ave W
- 166 N 9th St Unit 3
- 362 N 6th St
- 150 S 10th St
- 318 N 7th St
- 323 N 7th St
- 101 Ellington St
- 105 N 15th St
- 62 Ampere Pkwy
- 349 N 5th St
- 43 Ampere Pkwy
- 176 N 16th St
- 426 3rd Ave W Unit 428
- 426-428 3rd Ave W
- 428 3rd Ave W Unit 2
- 430 3rd Ave W
- 422 3rd Ave W Unit 424
- 432 3rd Ave W
- 248 N 9th St Unit 250
- 246 N 9th St
- 434 3rd Ave W Unit 436
- 434-436 3rd Ave W
- 244 N 9th St
- 423 3rd Ave W
- 418 3rd Ave W Unit 420
- 438 3rd Ave W
- 427 3rd Ave W Unit 429
- 415 3rd Ave W Unit 421
- 245 N 9th St Unit 247
- 431 3rd Ave W
- 416 3rd Ave W
- 37 Springdale Ave