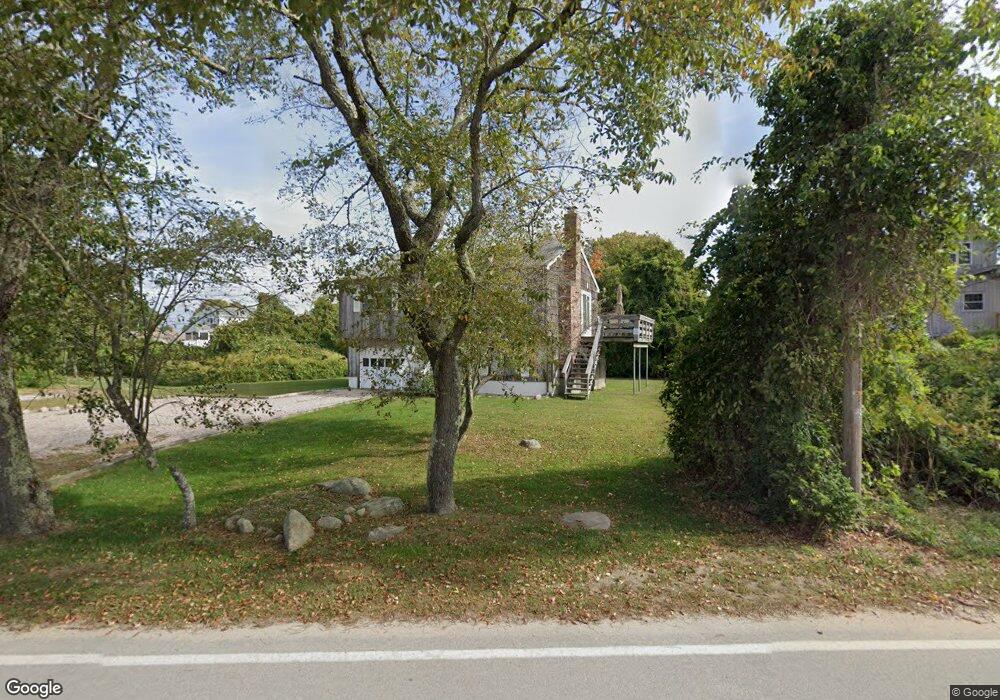
426 E Beach Rd Charlestown, RI 02813
Estimated Value: $1,017,000 - $1,361,000
2
Beds
2
Baths
1,150
Sq Ft
$988/Sq Ft
Est. Value
About This Home
This home is located at 426 E Beach Rd, Charlestown, RI 02813 and is currently estimated at $1,136,629, approximately $988 per square foot. 426 E Beach Rd is a home located in Washington County with nearby schools including Chariho Regional Middle School and Chariho High School.
Ownership History
Date
Name
Owned For
Owner Type
Purchase Details
Closed on
Dec 6, 2024
Sold by
Keeley Mark J and Keeley Margaret M
Bought by
Mark J Keeley Ret and Keeley
Current Estimated Value
Purchase Details
Closed on
Oct 1, 2004
Sold by
Maree Paul A and Maree Nancy A
Bought by
Keely Mark J and Keely Margaret M
Home Financials for this Owner
Home Financials are based on the most recent Mortgage that was taken out on this home.
Original Mortgage
$300,000
Interest Rate
5.81%
Mortgage Type
Purchase Money Mortgage
Purchase Details
Closed on
Mar 15, 2002
Sold by
Henault Gary and Henault Jacqueline
Bought by
Keeley Mark J and Keeley Margaret M
Purchase Details
Closed on
Mar 23, 2001
Sold by
Elia Glenn
Bought by
Henault Gary and Henault Jacqueline K
Purchase Details
Closed on
Jan 8, 2001
Sold by
Kraus John L and Pouliot Kathleen V
Bought by
Elia Glenn
Create a Home Valuation Report for This Property
The Home Valuation Report is an in-depth analysis detailing your home's value as well as a comparison with similar homes in the area
Home Values in the Area
Average Home Value in this Area
Purchase History
| Date | Buyer | Sale Price | Title Company |
|---|---|---|---|
| Mark J Keeley Ret | -- | None Available | |
| Mark J Keeley Ret | -- | None Available | |
| Keely Mark J | $174,500 | -- | |
| Keely Mark J | $174,500 | -- | |
| Keeley Mark J | $378,000 | -- | |
| Keeley Mark J | $378,000 | -- | |
| Henault Gary | $350,000 | -- | |
| Henault Gary | $350,000 | -- | |
| Elia Glenn | $260,000 | -- | |
| Elia Glenn | $260,000 | -- |
Source: Public Records
Mortgage History
| Date | Status | Borrower | Loan Amount |
|---|---|---|---|
| Previous Owner | Elia Glenn | $300,000 | |
| Previous Owner | Elia Glenn | $270,000 |
Source: Public Records
Tax History
| Year | Tax Paid | Tax Assessment Tax Assessment Total Assessment is a certain percentage of the fair market value that is determined by local assessors to be the total taxable value of land and additions on the property. | Land | Improvement |
|---|---|---|---|---|
| 2025 | $5,198 | $876,500 | $655,100 | $221,400 |
| 2024 | $5,066 | $876,500 | $655,100 | $221,400 |
| 2023 | $5,031 | $876,500 | $655,100 | $221,400 |
| 2022 | $4,496 | $550,300 | $389,900 | $160,400 |
| 2021 | $4,501 | $550,300 | $389,900 | $160,400 |
| 2020 | $4,432 | $538,500 | $389,900 | $148,600 |
| 2019 | $4,573 | $495,400 | $389,900 | $105,500 |
| 2018 | $4,776 | $495,400 | $389,900 | $105,500 |
| 2017 | $4,751 | $495,400 | $389,900 | $105,500 |
| 2016 | $4,889 | $478,800 | $375,300 | $103,500 |
| 2015 | $4,841 | $478,800 | $375,300 | $103,500 |
| 2014 | $4,740 | $478,800 | $375,300 | $103,500 |
Source: Public Records
Map
Nearby Homes
- 34 Buddington Rd
- 5717 Post Rd
- 853 W Beach Rd
- 27 W Willow Ln
- 137 Cove Point Rd E
- 135 Ross Hill Rd
- 143 Ross Hill Rd
- 14 Evergreen Ln
- 346 Post Rd
- 342 Post Rd
- 0 Post Rd Unit 1398131
- 4772 Old Post #24 Rd
- 4772 Old Post #23 Rd
- 4772 Old Post #25 Rd
- 5 Robin Hollow Ln
- 4772 Rd
- 4772 Old Post #22 Rd
- 4772 Rd
- 4772 Rd
- 4772 Old Post #21 Rd
- 418 E Beach Rd
- 438 E Beach Rd
- 423 E Beach Rd
- 91 Powaget Ave
- 415 E Beach Rd
- 103 Powaget Ave
- 406 E Beach Rd
- 431 E Beach Rd
- 79 Powaget Ave
- 427 E Beach Rd Unit A
- 427 E Beach Rd
- 439 E Beach Rd
- 401 E Beach Rd
- 94 Powaget Ave
- 71 Powaget Ave
- 9 Burdick St
- 106 Powaget Ave
- 88 Powaget Ave
- 392 E Beach Rd
- 397 E Beach Rd
Your Personal Tour Guide
Ask me questions while you tour the home.