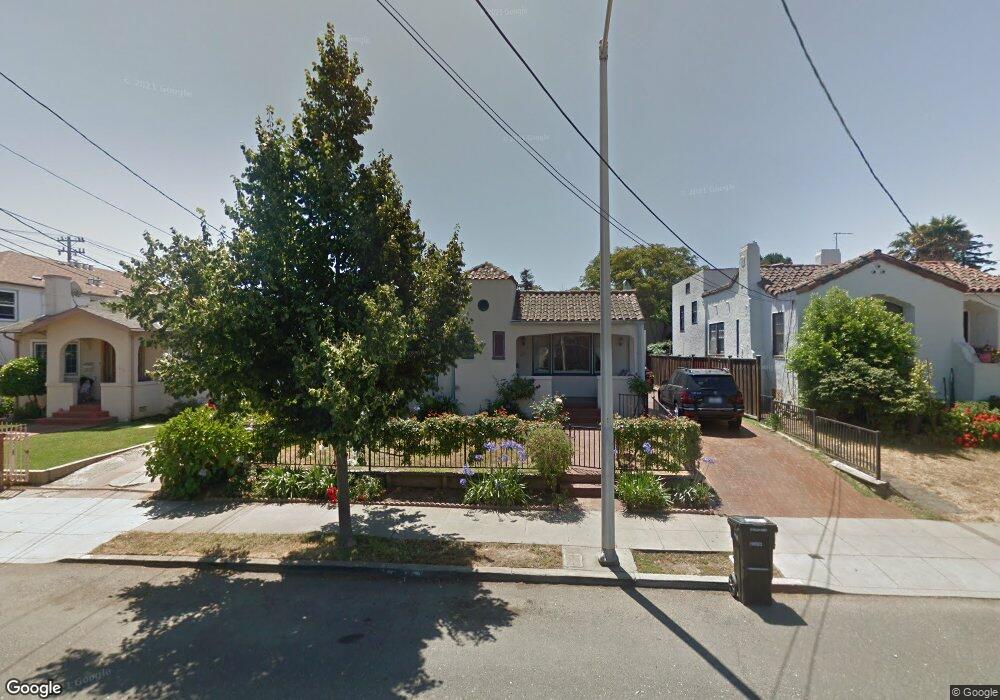
426 E Bellevue Ave Unit E San Mateo, CA 94401
North Central NeighborhoodEstimated Value: $1,333,000 - $1,707,000
3
Beds
1
Bath
1,360
Sq Ft
$1,077/Sq Ft
Est. Value
About This Home
This home is located at 426 E Bellevue Ave Unit E, San Mateo, CA 94401 and is currently estimated at $1,464,147, approximately $1,076 per square foot. 426 E Bellevue Ave Unit E is a home located in San Mateo County with nearby schools including San Mateo Park Elementary, Borel Middle School, and San Mateo High School.
Ownership History
Date
Name
Owned For
Owner Type
Purchase Details
Closed on
Mar 27, 2000
Sold by
Douglas Mark and Brower Douglas Demaris
Bought by
King Nigel G and King Anita
Current Estimated Value
Home Financials for this Owner
Home Financials are based on the most recent Mortgage that was taken out on this home.
Original Mortgage
$384,000
Outstanding Balance
$128,148
Interest Rate
7.87%
Estimated Equity
$1,335,999
Purchase Details
Closed on
Jan 22, 1997
Sold by
Spooner Ida Mae
Bought by
Douglas Mark and Brower Douglas Demaris
Home Financials for this Owner
Home Financials are based on the most recent Mortgage that was taken out on this home.
Original Mortgage
$235,450
Interest Rate
8.65%
Purchase Details
Closed on
Oct 31, 1995
Sold by
Spooner Ida Mae
Bought by
Spooner Ida Mae
Create a Home Valuation Report for This Property
The Home Valuation Report is an in-depth analysis detailing your home's value as well as a comparison with similar homes in the area
Home Values in the Area
Average Home Value in this Area
Purchase History
| Date | Buyer | Sale Price | Title Company |
|---|---|---|---|
| King Nigel G | $605,000 | North American Title Co | |
| Douglas Mark | $277,000 | North American Title Co | |
| Spooner Ida Mae | -- | -- |
Source: Public Records
Mortgage History
| Date | Status | Borrower | Loan Amount |
|---|---|---|---|
| Open | King Nigel G | $384,000 | |
| Previous Owner | Douglas Mark | $235,450 |
Source: Public Records
Tax History
| Year | Tax Paid | Tax Assessment Tax Assessment Total Assessment is a certain percentage of the fair market value that is determined by local assessors to be the total taxable value of land and additions on the property. | Land | Improvement |
|---|---|---|---|---|
| 2025 | $13,267 | $929,858 | $464,929 | $464,929 |
| 2023 | $13,267 | $893,752 | $446,876 | $446,876 |
| 2022 | $12,066 | $876,228 | $438,114 | $438,114 |
| 2021 | $11,880 | $859,048 | $429,524 | $429,524 |
| 2020 | $11,605 | $850,240 | $425,120 | $425,120 |
| 2019 | $11,189 | $833,570 | $416,785 | $416,785 |
| 2018 | $11,094 | $817,226 | $408,613 | $408,613 |
| 2017 | $9,658 | $801,202 | $400,601 | $400,601 |
| 2016 | $9,551 | $785,494 | $392,747 | $392,747 |
| 2015 | $9,496 | $773,696 | $386,848 | $386,848 |
| 2014 | $9,289 | $758,542 | $379,271 | $379,271 |
Source: Public Records
Map
Nearby Homes
- 617 Woodside Way Unit C
- 444 Villa Terrace
- 119 E Poplar Ave
- 633 Highland Ave Unit 1
- 249 Elm St Unit 104
- 422 Peninsula Ave
- 869 Woodside Way
- 800 N Delaware St Unit 303
- 816 N Delaware St Unit 409
- 820 N Delaware St Unit 215
- 932 Peninsula Ave Unit 406
- 821 N Humboldt St Unit 309
- 833 N Humboldt St Unit 201
- 934 Peninsula Ave Unit 301
- 835 N Humboldt St Unit 203
- 815 N Humboldt St Unit 508
- 316 N El Camino Real Unit 105
- 200 Elm St Unit 102
- 200 Elm St Unit 107
- 200 Elm St Unit 112
- 420 E Bellevue Ave Unit E
- 430 E Bellevue Ave Unit E
- 427 N Claremont St Unit B
- 427 N Claremont St
- 427 N Claremont St Unit 4
- 427 N Claremont St Unit 3
- 427 N Claremont St Unit 2
- 427 N Claremont St Unit 1
- 439 N Claremont St Unit 1
- 439 N Claremont St Unit 2
- 439 N Claremont St
- 439 N Claremont St
- 439 N Claremont St Unit N
- 416 E Bellevue Ave Unit E
- 423 N Claremont St Unit 4
- 423 N Claremont St Unit 3
- 423 N Claremont St Unit 2
- 423 N Claremont St Unit 1
- 412 E Bellevue Ave
- 441 E Bellevue Ave Unit E
Your Personal Tour Guide
Ask me questions while you tour the home.