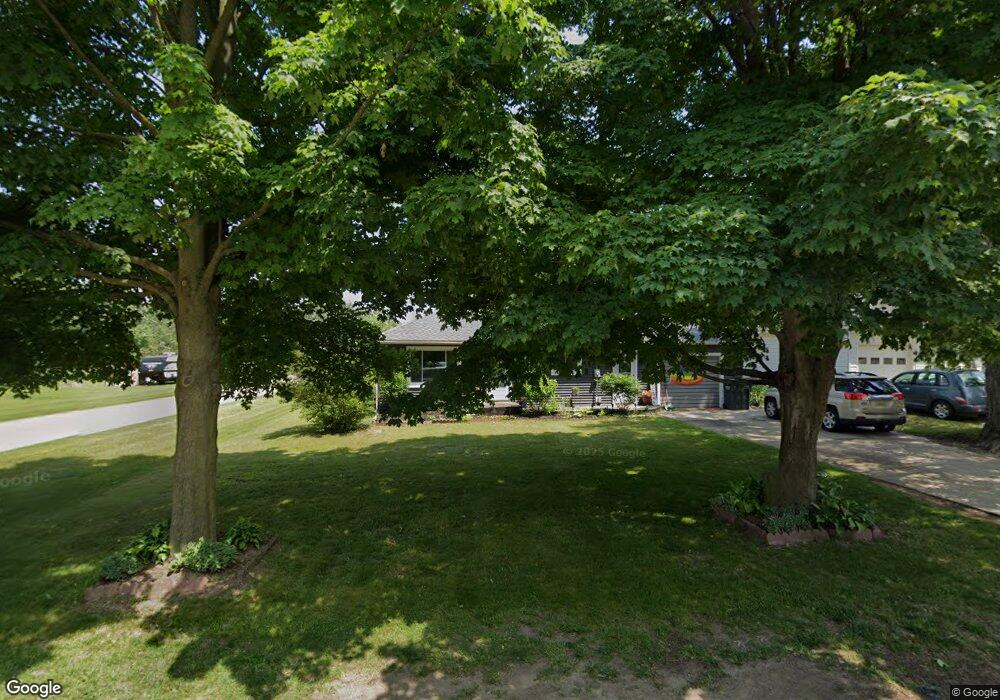
426 Forrest St Wayland, MI 49348
Estimated Value: $254,000 - $310,000
3
Beds
2
Baths
1,630
Sq Ft
$172/Sq Ft
Est. Value
About This Home
This home is located at 426 Forrest St, Wayland, MI 49348 and is currently estimated at $279,844, approximately $171 per square foot. 426 Forrest St is a home located in Allegan County with nearby schools including Wayland High School and St. Therese Catholic School.
Ownership History
Date
Name
Owned For
Owner Type
Purchase Details
Closed on
Aug 5, 2002
Sold by
Nousen Randall S and Nousen Teresa
Bought by
Varnagatas Jeffrey A and Varnagatas Melisende
Current Estimated Value
Home Financials for this Owner
Home Financials are based on the most recent Mortgage that was taken out on this home.
Original Mortgage
$113,121
Outstanding Balance
$48,107
Interest Rate
6.62%
Mortgage Type
FHA
Estimated Equity
$231,737
Purchase Details
Closed on
Jun 5, 1998
Sold by
Nousen Teresa and Davis Audie N
Bought by
Nousen Randall and Nousen Teresa
Purchase Details
Closed on
Mar 16, 1995
Sold by
Wayland Christian Ref Church
Bought by
Nousen Teresa and Davis Audie N
Create a Home Valuation Report for This Property
The Home Valuation Report is an in-depth analysis detailing your home's value as well as a comparison with similar homes in the area
Home Values in the Area
Average Home Value in this Area
Purchase History
| Date | Buyer | Sale Price | Title Company |
|---|---|---|---|
| Varnagatas Jeffrey A | $114,900 | Chicago Title | |
| Nousen Randall | -- | -- | |
| Nousen Teresa | $65,000 | -- |
Source: Public Records
Mortgage History
| Date | Status | Borrower | Loan Amount |
|---|---|---|---|
| Open | Varnagatas Jeffrey A | $113,121 |
Source: Public Records
Tax History Compared to Growth
Tax History
| Year | Tax Paid | Tax Assessment Tax Assessment Total Assessment is a certain percentage of the fair market value that is determined by local assessors to be the total taxable value of land and additions on the property. | Land | Improvement |
|---|---|---|---|---|
| 2025 | $2,299 | $126,200 | $11,900 | $114,300 |
| 2024 | $2,090 | $114,700 | $9,500 | $105,200 |
| 2023 | $2,090 | $81,600 | $9,400 | $72,200 |
| 2022 | $2,090 | $73,300 | $8,700 | $64,600 |
| 2021 | $1,956 | $67,700 | $8,700 | $59,000 |
| 2020 | $1,956 | $65,300 | $8,700 | $56,600 |
| 2019 | $0 | $63,200 | $8,400 | $54,800 |
| 2018 | $0 | $58,100 | $8,400 | $49,700 |
| 2017 | $0 | $59,100 | $8,400 | $50,700 |
| 2016 | $0 | $49,900 | $8,400 | $41,500 |
| 2015 | -- | $49,900 | $8,400 | $41,500 |
| 2014 | -- | $44,300 | $8,400 | $35,900 |
| 2013 | -- | $39,600 | $8,400 | $31,200 |
Source: Public Records
Map
Nearby Homes
- 545 N Main St
- 212 E Superior St
- 146 Hanlon Ct
- 3610 Garden St
- 110 E Sycamore St
- 621 S Main St
- 219 Alpine St
- 319 Alpine St
- 3685 Calkins Ct
- 3770 Division Ave S
- 3570 Windsor Woods Dr
- 1143 Regina Trail
- 330 Lotz Ct
- 835 Wild Flower Ct
- 4674 12th St
- 3282 Stonehill Ct
- 3296 Stonehill Ct
- 3897 Division St
- 3214 7th St
- 3669 Kalamazoo Dr