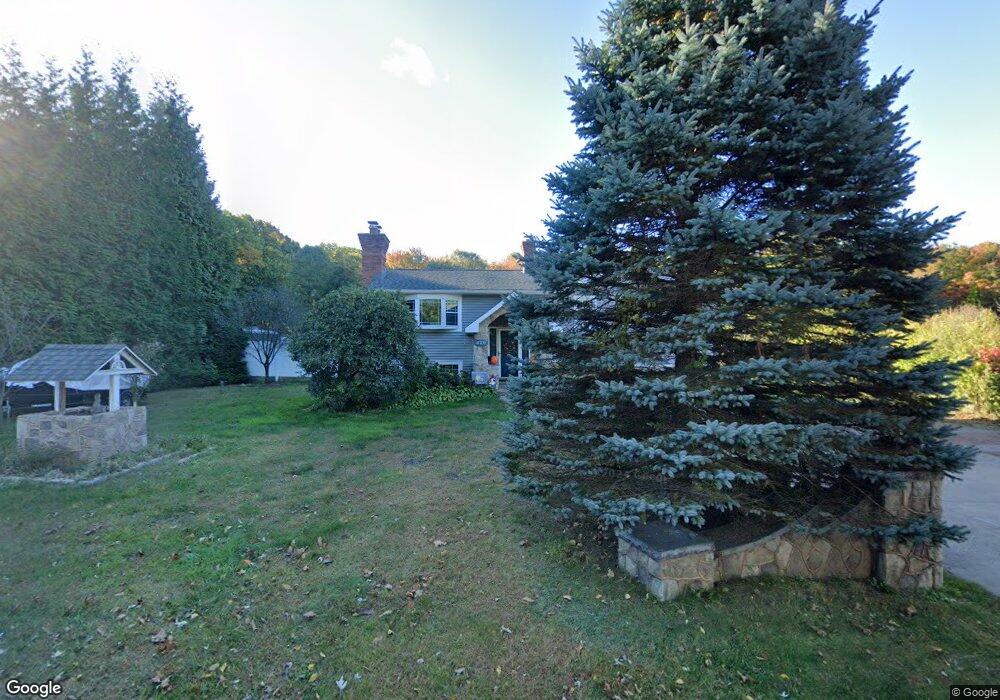
426 Lazy Ln Southington, CT 06489
West Southington NeighborhoodEstimated Value: $549,227 - $580,000
4
Beds
3
Baths
1,950
Sq Ft
$287/Sq Ft
Est. Value
About This Home
This home is located at 426 Lazy Ln, Southington, CT 06489 and is currently estimated at $559,807, approximately $287 per square foot. 426 Lazy Ln is a home located in Hartford County with nearby schools including Reuben E. Thalberg Elementary School, Joseph A. Depaolo Middle School, and Southington High School.
Ownership History
Date
Name
Owned For
Owner Type
Purchase Details
Closed on
Mar 10, 2006
Sold by
Zurrell Veronique J
Bought by
Olchanowski Wladyslaw and Olchanowski Janina
Current Estimated Value
Home Financials for this Owner
Home Financials are based on the most recent Mortgage that was taken out on this home.
Original Mortgage
$266,000
Interest Rate
6.15%
Purchase Details
Closed on
Dec 27, 1999
Sold by
Skoczylas Joseph and Skoczylas Henriette
Bought by
Zurell Todd A and Zurell Veronique J
Create a Home Valuation Report for This Property
The Home Valuation Report is an in-depth analysis detailing your home's value as well as a comparison with similar homes in the area
Home Values in the Area
Average Home Value in this Area
Purchase History
| Date | Buyer | Sale Price | Title Company |
|---|---|---|---|
| Olchanowski Wladyslaw | $332,500 | -- | |
| Zurell Todd A | $125,000 | -- |
Source: Public Records
Mortgage History
| Date | Status | Borrower | Loan Amount |
|---|---|---|---|
| Closed | Zurell Todd A | $266,000 | |
| Closed | Zurell Todd A | $49,875 | |
| Previous Owner | Zurell Todd A | $283,500 |
Source: Public Records
Tax History Compared to Growth
Tax History
| Year | Tax Paid | Tax Assessment Tax Assessment Total Assessment is a certain percentage of the fair market value that is determined by local assessors to be the total taxable value of land and additions on the property. | Land | Improvement |
|---|---|---|---|---|
| 2025 | $8,469 | $255,000 | $61,140 | $193,860 |
| 2024 | $8,003 | $254,560 | $61,140 | $193,420 |
| 2023 | $7,728 | $254,560 | $61,140 | $193,420 |
| 2022 | $7,415 | $254,560 | $61,140 | $193,420 |
| 2021 | $7,390 | $254,560 | $61,140 | $193,420 |
| 2020 | $7,132 | $232,840 | $62,390 | $170,450 |
| 2019 | $6,297 | $205,530 | $62,390 | $143,140 |
| 2018 | $6,265 | $205,530 | $62,390 | $143,140 |
| 2017 | $6,265 | $205,530 | $62,390 | $143,140 |
| 2016 | $6,092 | $205,530 | $62,390 | $143,140 |
| 2015 | $5,694 | $195,390 | $59,420 | $135,970 |
| 2014 | $5,541 | $195,390 | $59,420 | $135,970 |
Source: Public Records
Map
Nearby Homes
- 47 Gannet Dr
- 554 Spring St
- 45 Hart St
- 76 Kane St
- 0 Winchester Estates Lot 17
- 61 Pine Hollow Dr
- 110 W Pines Dr
- 62 Bagno Dr
- 273 Queen St Unit 9A
- 25 Whippoorwill Rd
- 81 Laning St
- 285 Queen St Unit 4F
- 500 Mill St Unit 3
- 31 Erica Ct
- 7 Meadow Rd
- 59 Water St
- 39 Morningside Ln
- 209 W Center St
- 26 Cedar Dr
- 452 Jude Ln