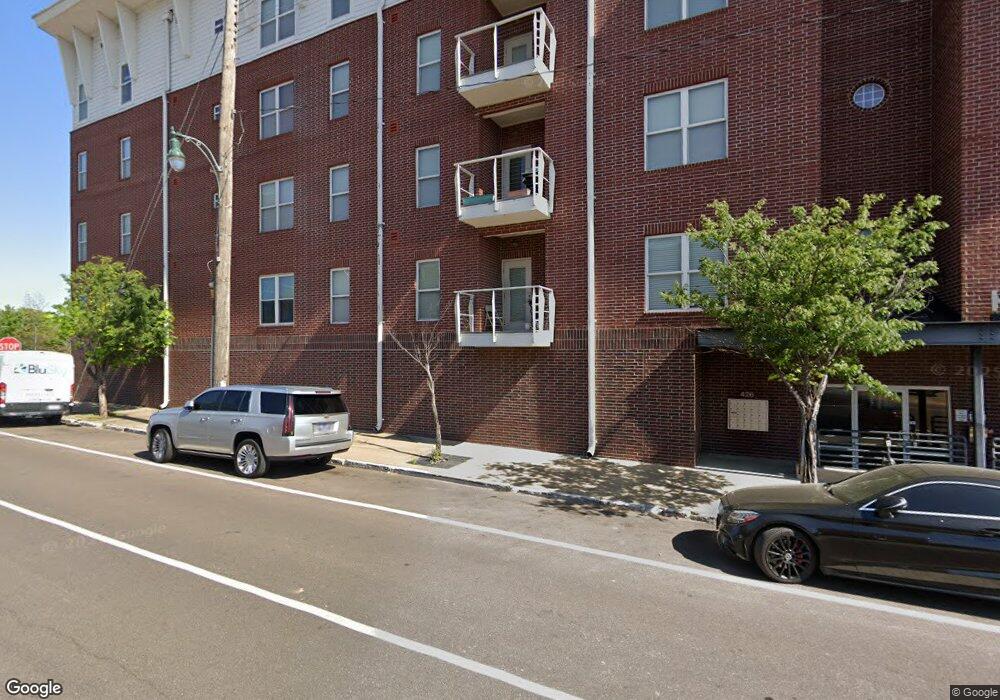
Harbor Lights 426 N Front St Unit 401A Memphis, TN 38103
Uptown Memphis NeighborhoodEstimated Value: $252,000 - $367,000
3
Beds
3
Baths
1,628
Sq Ft
$180/Sq Ft
Est. Value
About This Home
This home is located at 426 N Front St Unit 401A, Memphis, TN 38103 and is currently estimated at $293,233, approximately $180 per square foot. 426 N Front St Unit 401A is a home located in Shelby County with nearby schools including Downtown Elementary School, Manassas High School, and Memphis Scholars Caldwell-Guthrie.
Ownership History
Date
Name
Owned For
Owner Type
Purchase Details
Closed on
Nov 3, 2014
Sold by
Cumberland Trust And Investment Co
Bought by
Commerical Bank And Trust Co and Willie Highsmith Jr Irrevocable Trust
Current Estimated Value
Purchase Details
Closed on
Sep 29, 2011
Sold by
Mincey Jerry L and Mincey Nancy S
Bought by
Cumberland Trust & Investment Co and Willie Highsmith Jr Irrevocable Trust
Purchase Details
Closed on
Dec 20, 2010
Sold by
The Blue Group Ii Llc
Bought by
Saleem Enterprises Llc
Home Financials for this Owner
Home Financials are based on the most recent Mortgage that was taken out on this home.
Original Mortgage
$91,438
Interest Rate
4.18%
Mortgage Type
Commercial
Purchase Details
Closed on
Nov 4, 2010
Sold by
The Blue Group Ii Llc
Bought by
Mincey Jerry L and Mincey Nancy S
Home Financials for this Owner
Home Financials are based on the most recent Mortgage that was taken out on this home.
Original Mortgage
$91,438
Interest Rate
4.18%
Mortgage Type
Commercial
Create a Home Valuation Report for This Property
The Home Valuation Report is an in-depth analysis detailing your home's value as well as a comparison with similar homes in the area
Home Values in the Area
Average Home Value in this Area
Purchase History
| Date | Buyer | Sale Price | Title Company |
|---|---|---|---|
| Commerical Bank And Trust Co | -- | None Available | |
| Cumberland Trust & Investment Co | $165,000 | None Available | |
| Saleem Enterprises Llc | $105,875 | None Available | |
| Mincey Jerry L | $165,000 | None Available |
Source: Public Records
Mortgage History
| Date | Status | Borrower | Loan Amount |
|---|---|---|---|
| Previous Owner | Saleem Enterprises Llc | $91,438 | |
| Previous Owner | Mincey Jerry L | $160,310 |
Source: Public Records
Tax History Compared to Growth
Tax History
| Year | Tax Paid | Tax Assessment Tax Assessment Total Assessment is a certain percentage of the fair market value that is determined by local assessors to be the total taxable value of land and additions on the property. | Land | Improvement |
|---|---|---|---|---|
| 2025 | $2,026 | $68,825 | $2,025 | $66,800 |
| 2024 | $2,026 | $59,775 | $2,025 | $57,750 |
| 2023 | $3,641 | $59,775 | $2,025 | $57,750 |
| 2022 | $3,641 | $59,775 | $2,025 | $57,750 |
| 2021 | $3,684 | $59,775 | $2,025 | $57,750 |
| 2020 | $3,301 | $45,550 | $2,025 | $43,525 |
| 2019 | $3,301 | $45,550 | $2,025 | $43,525 |
| 2018 | $3,301 | $45,550 | $2,025 | $43,525 |
| 2017 | $1,872 | $45,550 | $2,025 | $43,525 |
| 2016 | $1,698 | $38,850 | $0 | $0 |
| 2014 | $1,698 | $38,850 | $0 | $0 |
Source: Public Records
About Harbor Lights
Map
Nearby Homes
- 430 N Front St
- 680 Harbor Bend Rd Unit 203
- 680 Harbor Bend Rd Unit 103
- 218 Mill Ave
- 113 Harbor Town Square Unit 301
- 358 N Island Dr Unit 105
- 140 Marina Point Ln
- 380 N Island Dr Unit 314
- 380 N Island Dr Unit 105
- 380 N Island Dr Unit 302
- 805 Harbor Isle Cir W
- 506 N 6th St
- 844 Harbor Isle Cir E
- 840 Harbor Crest Dr
- 128 Harbor Town Blvd
- 325 Greenlaw Ave
- 596 N 6th St
- 824 River Park Dr
- 645 Greenlaw Place
- 866 River Park Dr
- 426 N Front St Unit 103A
- 426 N Front St Unit 103B
- 426 N Front St Unit 303A
- 426 N Front St Unit 303B
- 426 N Front St Unit 205
- 426 N Front St Unit 405
- 426 N Front St Unit 206 - 203
- 426 N Front St Unit 106F
- 426 N Front St Unit 104D
- 426 N Front St Unit 404D
- 426 N Front St Unit 304D
- 426 N Front St Unit 403E
- 426 N Front St Unit 402B
- 426 N Front St Unit 307E
- 426 N Front St Unit 306F
- 426 N Front St Unit 305C
- 426 N Front St Unit 303C
- 426 N Front St Unit 301A
- 426 N Front St Unit 206F
- 426 N Front St Unit 204D