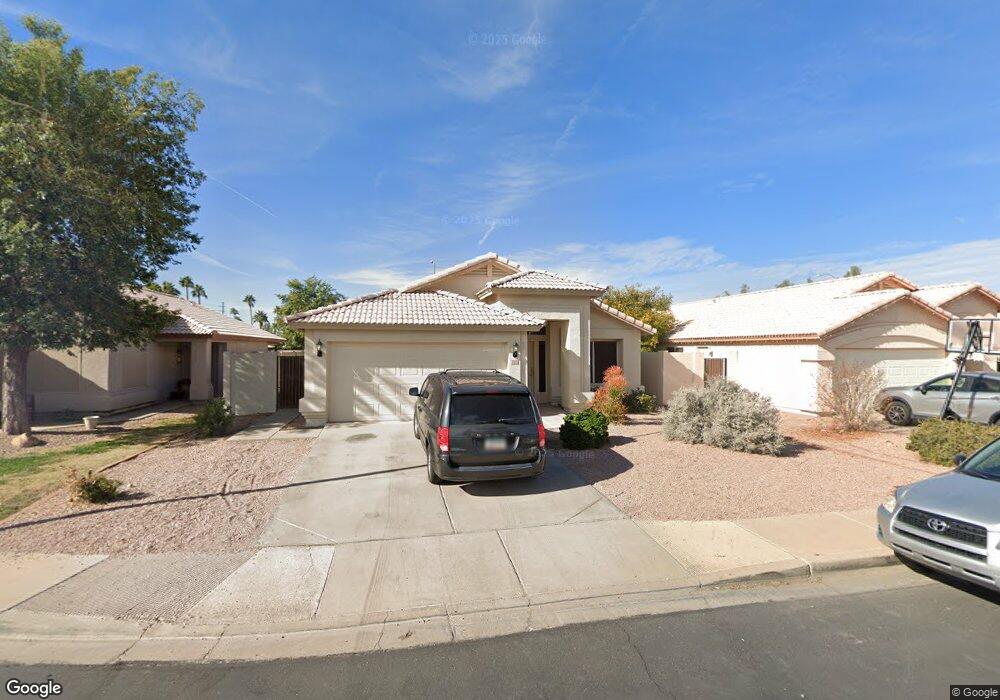
426 N Whiting Mesa, AZ 85213
North Central Mesa NeighborhoodEstimated Value: $416,190 - $449,000
3
Beds
2
Baths
1,643
Sq Ft
$261/Sq Ft
Est. Value
About This Home
This home is located at 426 N Whiting, Mesa, AZ 85213 and is currently estimated at $429,298, approximately $261 per square foot. 426 N Whiting is a home located in Maricopa County with nearby schools including Field Elementary School, Franklin at Brimhall Elementary School, and Franklin West Elementary School.
Ownership History
Date
Name
Owned For
Owner Type
Purchase Details
Closed on
Jun 11, 2004
Sold by
Taylor Boyd D and Taylor Janet
Bought by
Bt Rental Properties Llc
Current Estimated Value
Purchase Details
Closed on
Jun 27, 2003
Sold by
Federal Home Loan Mortgage Corporation
Bought by
Taylor Boyd D and Taylor Janet
Purchase Details
Closed on
Apr 15, 2003
Sold by
Price Jonathon B
Bought by
Federal Home Loan Mortgage Corporation
Purchase Details
Closed on
Mar 28, 2002
Sold by
Rosenberg Michele M E
Bought by
Price Jonathon B
Home Financials for this Owner
Home Financials are based on the most recent Mortgage that was taken out on this home.
Original Mortgage
$142,000
Interest Rate
7.13%
Mortgage Type
New Conventional
Purchase Details
Closed on
Mar 18, 1996
Sold by
Fulton Homes Corp
Bought by
Rosenberg Michele M E
Home Financials for this Owner
Home Financials are based on the most recent Mortgage that was taken out on this home.
Original Mortgage
$110,225
Interest Rate
7.05%
Mortgage Type
FHA
Create a Home Valuation Report for This Property
The Home Valuation Report is an in-depth analysis detailing your home's value as well as a comparison with similar homes in the area
Home Values in the Area
Average Home Value in this Area
Purchase History
| Date | Buyer | Sale Price | Title Company |
|---|---|---|---|
| Bt Rental Properties Llc | -- | -- | |
| Taylor Boyd D | $139,700 | First American Title Ins Co | |
| Federal Home Loan Mortgage Corporation | $135,083 | Security Title Agency | |
| Price Jonathon B | $142,000 | Capital Title Agency Inc | |
| Rosenberg Michele M E | $114,465 | Security Title |
Source: Public Records
Mortgage History
| Date | Status | Borrower | Loan Amount |
|---|---|---|---|
| Previous Owner | Price Jonathon B | $142,000 | |
| Previous Owner | Rosenberg Michele M E | $110,225 |
Source: Public Records
Tax History Compared to Growth
Tax History
| Year | Tax Paid | Tax Assessment Tax Assessment Total Assessment is a certain percentage of the fair market value that is determined by local assessors to be the total taxable value of land and additions on the property. | Land | Improvement |
|---|---|---|---|---|
| 2025 | $1,648 | $16,707 | -- | -- |
| 2024 | $1,653 | $15,911 | -- | -- |
| 2023 | $1,653 | $29,760 | $5,950 | $23,810 |
| 2022 | $1,619 | $23,250 | $4,650 | $18,600 |
| 2021 | $1,639 | $22,250 | $4,450 | $17,800 |
| 2020 | $1,617 | $20,170 | $4,030 | $16,140 |
| 2019 | $1,511 | $18,380 | $3,670 | $14,710 |
| 2018 | $1,450 | $17,160 | $3,430 | $13,730 |
| 2017 | $1,407 | $15,600 | $3,120 | $12,480 |
| 2016 | $1,381 | $16,700 | $3,340 | $13,360 |
| 2015 | $1,298 | $11,810 | $2,360 | $9,450 |
Source: Public Records
Map
Nearby Homes
- 2458 E University Dr Unit 2
- 2459 E Baltimore St
- 2416 E University Dr Unit 4
- 2610 E University Dr
- 2607 E Camino St
- 2301 E University Dr Unit 244
- 2301 E University Dr Unit 209
- 2301 E University Dr Unit 341
- 2301 E University Dr Unit 334
- 2301 E University Dr Unit 505
- 2301 E University Dr Unit 339
- 2301 E University Dr Unit 401
- 2301 E University Dr Unit 172
- 2301 E University Dr Unit 144
- 645 N Windsor
- 148 N Glenview
- 306 N Winthrop Cir
- 235 N 22nd Place Unit 535
- 721 N 25th St
- 2166 E University Dr
- 432 N Whiting
- 420 N Whiting
- 436 N Whiting
- 2520 E Cicero St
- 440 N Whiting
- 2459 E Caballero St
- 2526 E Cicero St
- 2521 E Caballero St
- 444 N Whiting
- 2458 E University Dr Unit 3
- 2458 E University Dr Unit 1
- 2452 E University Dr Unit 2
- 2452 E University Dr Unit 7
- 2452 E University Dr Unit 8
- 2452 E University Dr Unit 3
- 2452 E University Dr Unit 1
- 2527 E Caballero St
- 2453 E Caballero St
- 2530 E Cicero St
- 2460 E Caballero St