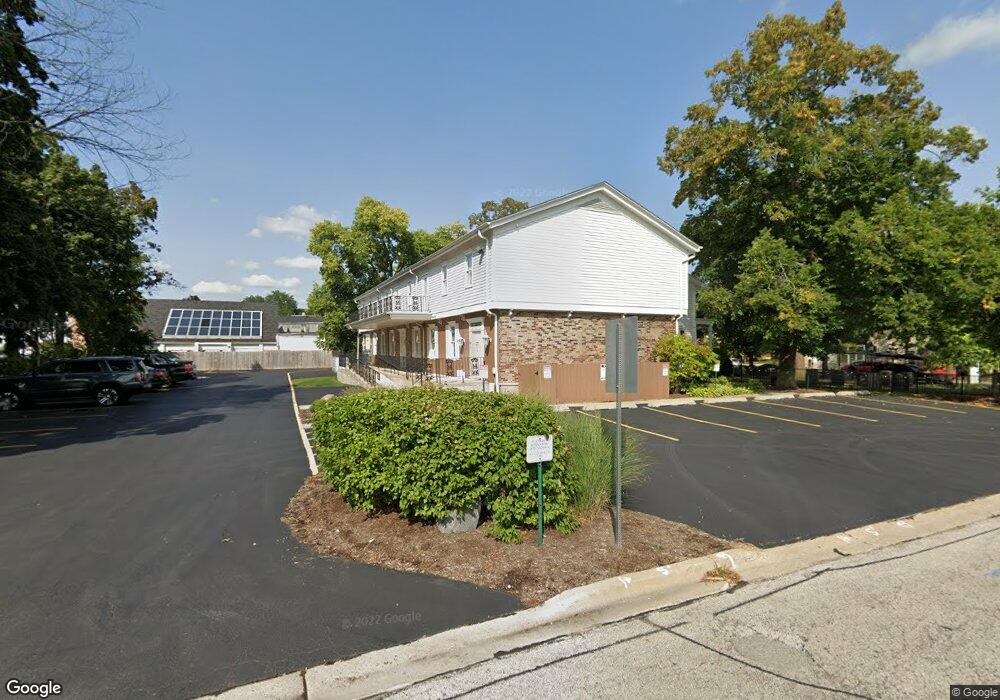
426 S 3rd St Unit 1 Geneva, IL 60134
Downtown Geneva NeighborhoodEstimated Value: $1,384,565
--
Bed
--
Bath
--
Sq Ft
0.3
Acres
About This Home
This home is located at 426 S 3rd St Unit 1, Geneva, IL 60134 and is currently priced at $1,384,565. 426 S 3rd St Unit 1 is a home located in Kane County with nearby schools including Williamsburg Elementary School, Geneva Community High School, and St. Peter School.
Ownership History
Date
Name
Owned For
Owner Type
Purchase Details
Closed on
Jan 28, 2025
Sold by
Enlightened Wellness Enterprises Llc and Kane Investments Llc
Bought by
Mandala Investments Ii Llc and Majxner
Current Estimated Value
Home Financials for this Owner
Home Financials are based on the most recent Mortgage that was taken out on this home.
Original Mortgage
$1,400,000
Outstanding Balance
$1,391,583
Interest Rate
6.85%
Mortgage Type
New Conventional
Purchase Details
Closed on
Dec 27, 2012
Sold by
James Street Llc
Bought by
Enlightened Wellness Enterprises Llc
Home Financials for this Owner
Home Financials are based on the most recent Mortgage that was taken out on this home.
Original Mortgage
$635,000
Interest Rate
3.32%
Mortgage Type
Commercial
Purchase Details
Closed on
May 1, 2002
Sold by
Lasalle Bank Na
Bought by
James Street Llc
Home Financials for this Owner
Home Financials are based on the most recent Mortgage that was taken out on this home.
Original Mortgage
$1,100,000
Interest Rate
6.87%
Mortgage Type
Purchase Money Mortgage
Create a Home Valuation Report for This Property
The Home Valuation Report is an in-depth analysis detailing your home's value as well as a comparison with similar homes in the area
Home Values in the Area
Average Home Value in this Area
Purchase History
| Date | Buyer | Sale Price | Title Company |
|---|---|---|---|
| Mandala Investments Ii Llc | $2,100,000 | Chicago Title | |
| Enlightened Wellness Enterprises Llc | $635,000 | Fox Title Company | |
| James Street Llc | $1,250,000 | -- |
Source: Public Records
Mortgage History
| Date | Status | Borrower | Loan Amount |
|---|---|---|---|
| Open | Mandala Investments Ii Llc | $1,400,000 | |
| Previous Owner | Enlightened Wellness Enterprises Llc | $635,000 | |
| Previous Owner | James Street Llc | $1,100,000 |
Source: Public Records
Tax History Compared to Growth
Tax History
| Year | Tax Paid | Tax Assessment Tax Assessment Total Assessment is a certain percentage of the fair market value that is determined by local assessors to be the total taxable value of land and additions on the property. | Land | Improvement |
|---|---|---|---|---|
| 2024 | $23,876 | $299,550 | $126,866 | $172,684 |
| 2023 | $23,394 | $272,318 | $115,333 | $156,985 |
| 2022 | $21,990 | $253,037 | $107,167 | $145,870 |
| 2021 | $21,551 | $243,633 | $103,184 | $140,449 |
| 2020 | $21,321 | $239,914 | $101,609 | $138,305 |
| 2019 | $21,290 | $235,371 | $99,685 | $135,686 |
| 2018 | $20,708 | $228,910 | $111,426 | $117,484 |
| 2017 | $20,514 | $222,805 | $108,454 | $114,351 |
| 2016 | $20,626 | $219,794 | $106,988 | $112,806 |
| 2015 | -- | $208,969 | $101,719 | $107,250 |
| 2014 | -- | $216,490 | $98,391 | $118,099 |
| 2013 | -- | $236,707 | $98,391 | $138,316 |
Source: Public Records
Map
Nearby Homes
- 315 S 5th St
- 213 S 5th St
- 413 Cheever Ave
- 108 S River Ln
- 221 Campbell Ct
- 246 Kenston Ct Unit 246
- 57 S 7th St
- 747 Cheever Ave
- 615 Easton Ave
- 228 Crissey Ave
- Lot 31 Fox Run Dr
- 515 Peyton St
- 710 Peck Rd
- 771 Fox Run Dr
- 1211 James St
- 301 Country Club Place
- 1301 S Batavia Ave
- 921 Western Ave
- 1437 Cooper Ln
- 1088 Dunstan Rd
- 426 S 3rd St Unit 3
- 426 S 3rd St Unit 2B
- 426 S 3rd St
- 325 South St
- 477 S 3rd St
- 328 S 3rd St Unit B
- 328 S 3rd St Unit D
- 500 S Third St
- 500 S Third St
- 414 S 4th St
- 422 S 4th St
- 507 S 3rd St Unit D
- 406 S 4th St
- 317 S 3rd St Unit A
- 502 S 4th St
- 415 S 5th St
- 317 S 3rd St Unit B
- 403 Fulton St
- 215 Fulton St
- 428 Fulton St