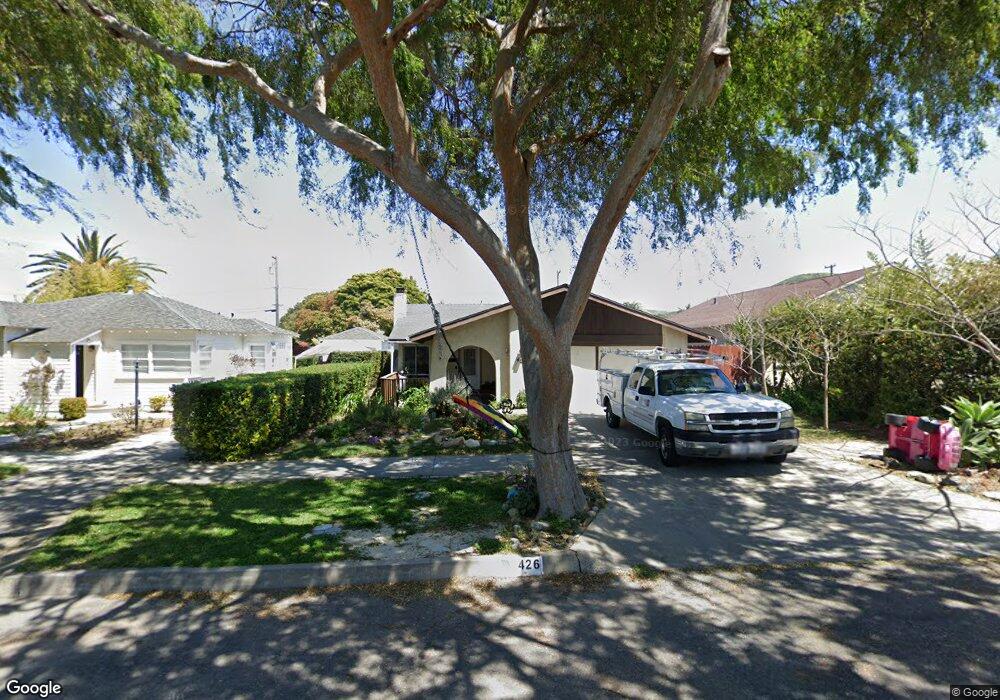
426 S M St Lompoc, CA 93436
Estimated Value: $543,979 - $588,000
3
Beds
2
Baths
1,215
Sq Ft
$462/Sq Ft
Est. Value
About This Home
This home is located at 426 S M St, Lompoc, CA 93436 and is currently estimated at $560,745, approximately $461 per square foot. 426 S M St is a home located in Santa Barbara County with nearby schools including Miguelito Elementary School, Lompoc Valley Middle School, and Lompoc High School.
Ownership History
Date
Name
Owned For
Owner Type
Purchase Details
Closed on
Mar 24, 2023
Sold by
Landon Stacey C
Bought by
Landon Cory and Landon Stacey C
Current Estimated Value
Purchase Details
Closed on
Jun 19, 2007
Sold by
Lopez Michael James
Bought by
Dodds Stacey C
Home Financials for this Owner
Home Financials are based on the most recent Mortgage that was taken out on this home.
Original Mortgage
$54,900
Interest Rate
6.16%
Mortgage Type
Stand Alone Second
Create a Home Valuation Report for This Property
The Home Valuation Report is an in-depth analysis detailing your home's value as well as a comparison with similar homes in the area
Home Values in the Area
Average Home Value in this Area
Purchase History
| Date | Buyer | Sale Price | Title Company |
|---|---|---|---|
| Landon Cory | -- | -- | |
| Dodds Stacey C | $366,000 | First American Title Company |
Source: Public Records
Mortgage History
| Date | Status | Borrower | Loan Amount |
|---|---|---|---|
| Previous Owner | Dodds Stacey C | $54,900 | |
| Previous Owner | Dodds Stacey C | $292,800 |
Source: Public Records
Tax History
| Year | Tax Paid | Tax Assessment Tax Assessment Total Assessment is a certain percentage of the fair market value that is determined by local assessors to be the total taxable value of land and additions on the property. | Land | Improvement |
|---|---|---|---|---|
| 2025 | $4,768 | $450,000 | $232,000 | $218,000 |
| 2023 | $4,768 | $390,000 | $201,000 | $189,000 |
| 2022 | $4,345 | $382,000 | $197,000 | $185,000 |
| 2021 | $3,900 | $332,000 | $171,000 | $161,000 |
| 2020 | $3,539 | $301,000 | $155,000 | $146,000 |
| 2019 | $3,479 | $295,000 | $152,000 | $143,000 |
| 2018 | $3,330 | $281,000 | $145,000 | $136,000 |
| 2017 | $3,181 | $268,000 | $138,000 | $130,000 |
| 2016 | $2,904 | $244,000 | $126,000 | $118,000 |
| 2014 | $2,550 | $211,000 | $109,000 | $102,000 |
Source: Public Records
Map
Nearby Homes
- 403 S M St
- 413 S O Place
- 215 S H St
- 117 S I St
- 1220 W Lime Ave
- 616 University Dr
- 209 S Sage St
- 217 N M St
- 23 Village Circle Dr
- 801, 851 California 246
- 1011 W Walnut Ave
- 60 Village Circle Dr
- 225 Village Circle Dr
- 321 N K St
- 1410 W Apricot Ave
- 319 S B St
- 1408 W Walnut Ave
- 113 N B St
- 230 N D St
- 112 N X St