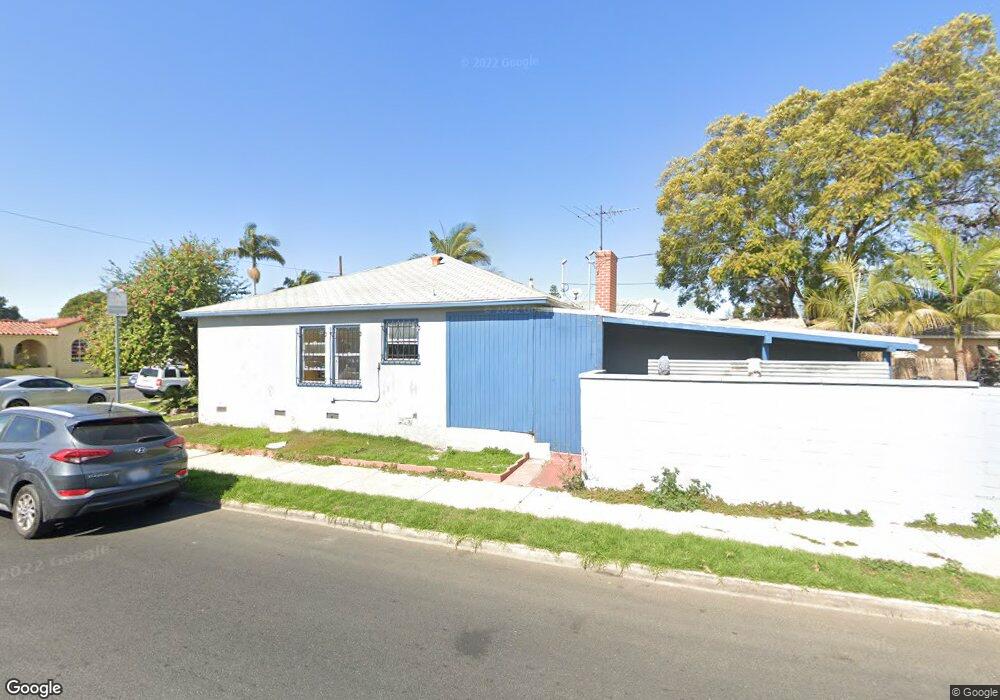
426 S Mayo Ave Compton, CA 90221
Estimated Value: $606,000 - $759,000
2
Beds
1
Bath
1,501
Sq Ft
$461/Sq Ft
Est. Value
About This Home
This home is located at 426 S Mayo Ave, Compton, CA 90221 and is currently estimated at $692,538, approximately $461 per square foot. 426 S Mayo Ave is a home located in Los Angeles County with nearby schools including Emerson Elementary School, Roosevelt Middle School, and Dominguez High School.
Ownership History
Date
Name
Owned For
Owner Type
Purchase Details
Closed on
Jul 18, 2000
Sold by
Tanuvasa Soe
Bought by
Tanuvasa Soe and Tanuvasa James Tapuvae
Current Estimated Value
Purchase Details
Closed on
Nov 12, 1997
Sold by
National Office Of Samoan Affairs
Bought by
Tanuvasa Soe and Tanuvasa James Tapuvae
Home Financials for this Owner
Home Financials are based on the most recent Mortgage that was taken out on this home.
Original Mortgage
$115,133
Interest Rate
7.16%
Mortgage Type
FHA
Purchase Details
Closed on
Sep 13, 1996
Sold by
Hud
Bought by
National Office Of Samoan Affairs
Home Financials for this Owner
Home Financials are based on the most recent Mortgage that was taken out on this home.
Original Mortgage
$124,950
Interest Rate
7.9%
Mortgage Type
FHA
Purchase Details
Closed on
Nov 27, 1995
Sold by
Sly Pete W
Bought by
Hud
Create a Home Valuation Report for This Property
The Home Valuation Report is an in-depth analysis detailing your home's value as well as a comparison with similar homes in the area
Home Values in the Area
Average Home Value in this Area
Purchase History
| Date | Buyer | Sale Price | Title Company |
|---|---|---|---|
| Tanuvasa Soe | -- | -- | |
| Tanuvasa Soe | $116,000 | -- | |
| National Office Of Samoan Affairs | $117,500 | California Counties Title Co | |
| Hud | $165,636 | Continental Lawyers Title Co |
Source: Public Records
Mortgage History
| Date | Status | Borrower | Loan Amount |
|---|---|---|---|
| Previous Owner | Tanuvasa Soe | $115,133 | |
| Previous Owner | National Office Of Samoan Affairs | $124,950 |
Source: Public Records
Tax History
| Year | Tax Paid | Tax Assessment Tax Assessment Total Assessment is a certain percentage of the fair market value that is determined by local assessors to be the total taxable value of land and additions on the property. | Land | Improvement |
|---|---|---|---|---|
| 2025 | $4,086 | $194,296 | $103,894 | $90,402 |
| 2024 | $4,086 | $190,487 | $101,857 | $88,630 |
| 2023 | $4,029 | $186,753 | $99,860 | $86,893 |
| 2022 | $3,503 | $183,092 | $97,902 | $85,190 |
| 2021 | $3,529 | $179,503 | $95,983 | $83,520 |
| 2019 | $3,433 | $174,181 | $93,137 | $81,044 |
| 2018 | $3,296 | $170,766 | $91,311 | $79,455 |
| 2016 | $3,134 | $164,137 | $87,766 | $76,371 |
| 2015 | $3,003 | $161,672 | $86,448 | $75,224 |
| 2014 | $2,956 | $158,506 | $84,755 | $73,751 |
Source: Public Records
Map
Nearby Homes
- 501 S Pearl Ave
- 621 S Burris Ave
- 423 S Poinsettia Ave
- 404 S Poinsettia Ave
- 211 S Poinsettia Ave
- 110 S Sloan Ave
- 212 S Santa fe Ave
- 718 S Poinsettia Ave
- 822 S Chester Ave
- 805 S Crane Ave
- 1301 E Alondra Blvd
- 405 S Ward Ave
- 223 N Chester Ave
- 2416 E Alondra Blvd
- 706 E Palmer St
- 204 N Spring Ave
- 411 N Chester Ave
- 165 Racquet Club Dr
- 1100 E Tichenor St
- 201 Racquet Club Dr
- 422 S Mayo Ave
- 500 S Mayo Ave
- 418 S Mayo Ave
- 504 S Mayo Ave
- 427 S Burris Ave
- 414 S Mayo Ave
- 421 S Burris Ave
- 417 S Burris Ave
- 501 S Burris Ave
- 425 S Mayo Ave
- 508 S Mayo Ave
- 408 S Mayo Ave
- 421 S Mayo Ave
- 413 S Burris Ave
- 501 S Mayo Ave
- 507 S Burris Ave
- 417 S Mayo Ave
- 505 S Mayo Ave
- 409 S Burris Ave
- 512 S Mayo Ave
Your Personal Tour Guide
Ask me questions while you tour the home.