Estimated Value: $200,000 - $218,000
3
Beds
3
Baths
1,357
Sq Ft
$153/Sq Ft
Est. Value
About This Home
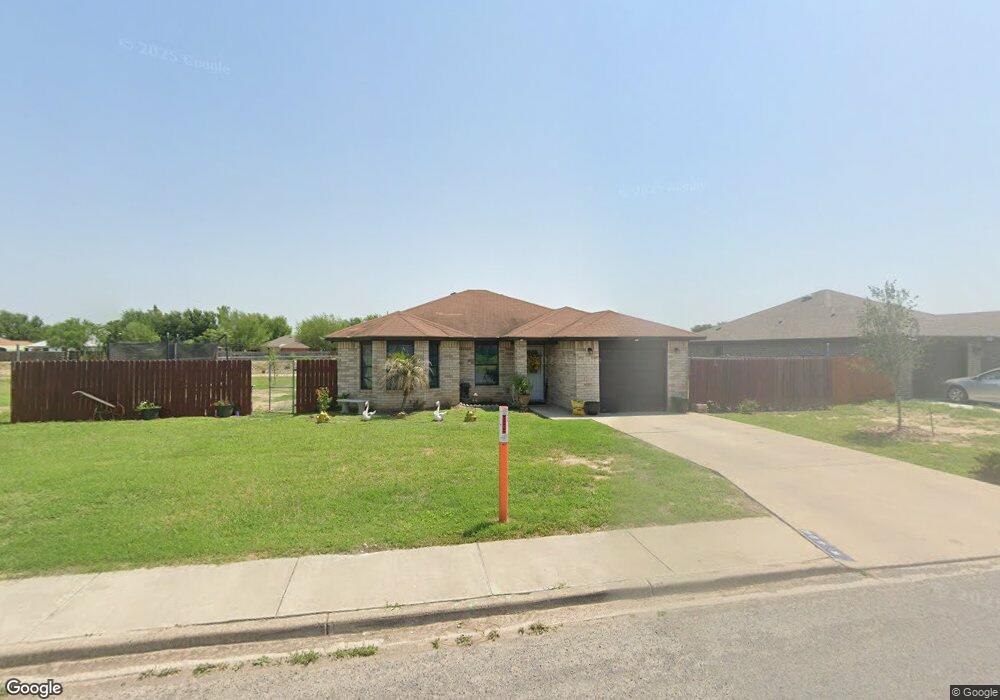
This home is located at 426 Serg Loop, Alamo, TX 78516 and is currently estimated at $207,500, approximately $152 per square foot. 426 Serg Loop is a home with nearby schools including Capt. D. Salinas Elementary School, A.P. Solis Middle School, and Donna High School.
Ownership History
Date
Name
Owned For
Owner Type
Purchase Details
Closed on
Jul 19, 2013
Sold by
Rio Grande Habitat For Humanity Inc
Bought by
Reyna Jesus and Coronado Jennifer Fermina
Current Estimated Value
Home Financials for this Owner
Home Financials are based on the most recent Mortgage that was taken out on this home.
Original Mortgage
$45,000
Outstanding Balance
$32,735
Interest Rate
3.93%
Mortgage Type
Purchase Money Mortgage
Estimated Equity
$174,765
Create a Home Valuation Report for This Property
The Home Valuation Report is an in-depth analysis detailing your home's value as well as a comparison with similar homes in the area
Home Values in the Area
Average Home Value in this Area
Purchase History
| Date | Buyer | Sale Price | Title Company |
|---|---|---|---|
| Reyna Jesus | -- | Vltc |
Source: Public Records
Mortgage History
| Date | Status | Borrower | Loan Amount |
|---|---|---|---|
| Open | Reyna Jesus | $45,000 |
Source: Public Records
Tax History Compared to Growth
Tax History
| Year | Tax Paid | Tax Assessment Tax Assessment Total Assessment is a certain percentage of the fair market value that is determined by local assessors to be the total taxable value of land and additions on the property. | Land | Improvement |
|---|---|---|---|---|
| 2025 | $4,660 | $199,189 | $63,000 | $136,189 |
| 2024 | $4,660 | $178,974 | $56,000 | $122,974 |
| 2023 | $4,589 | $180,295 | $56,000 | $124,295 |
| 2022 | $4,095 | $157,184 | $35,000 | $122,184 |
| 2021 | $3,558 | $135,604 | $35,000 | $100,604 |
| 2020 | $3,345 | $123,394 | $31,938 | $91,456 |
| 2019 | $2,893 | $105,482 | $31,938 | $73,544 |
| 2018 | $2,895 | $106,272 | $31,938 | $74,334 |
| 2017 | $2,736 | $99,189 | $24,063 | $75,126 |
| 2016 | $2,391 | $86,695 | $24,063 | $62,632 |
| 2015 | $2,257 | $86,082 | $24,063 | $62,019 |
Source: Public Records
Map
Nearby Homes