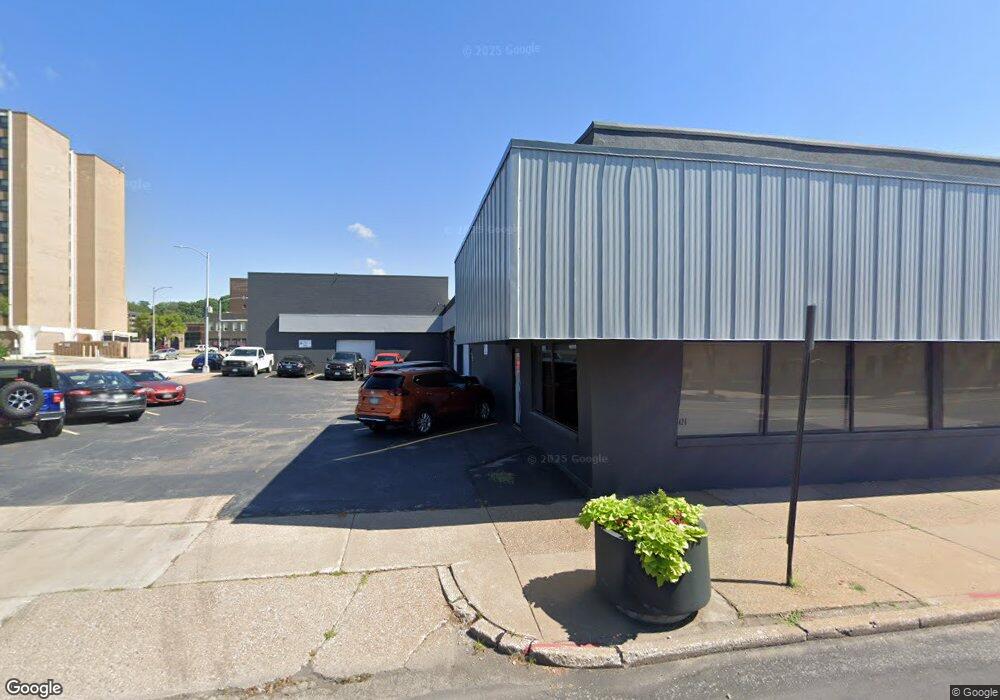
426 W 2nd St Davenport, IA 52801
Downtown Davenport NeighborhoodEstimated Value: $573,757
--
Bed
--
Bath
11,500
Sq Ft
$50/Sq Ft
Est. Value
About This Home
This home is located at 426 W 2nd St, Davenport, IA 52801 and is currently estimated at $573,757, approximately $49 per square foot. 426 W 2nd St is a home located in Scott County with nearby schools including Walnut Hill Elementary School, McKinley Elementary School, and Casey County Middle School.
Ownership History
Date
Name
Owned For
Owner Type
Purchase Details
Closed on
Jul 27, 2009
Sold by
Jlm Properties Llc
Bought by
Luxury Holdings Inc
Current Estimated Value
Home Financials for this Owner
Home Financials are based on the most recent Mortgage that was taken out on this home.
Original Mortgage
$250,000
Outstanding Balance
$165,055
Interest Rate
5.62%
Mortgage Type
Future Advance Clause Open End Mortgage
Estimated Equity
$408,702
Create a Home Valuation Report for This Property
The Home Valuation Report is an in-depth analysis detailing your home's value as well as a comparison with similar homes in the area
Home Values in the Area
Average Home Value in this Area
Purchase History
| Date | Buyer | Sale Price | Title Company |
|---|---|---|---|
| Luxury Holdings Inc | $265,000 | None Available |
Source: Public Records
Mortgage History
| Date | Status | Borrower | Loan Amount |
|---|---|---|---|
| Open | Luxury Holdings Inc | $250,000 |
Source: Public Records
Tax History Compared to Growth
Tax History
| Year | Tax Paid | Tax Assessment Tax Assessment Total Assessment is a certain percentage of the fair market value that is determined by local assessors to be the total taxable value of land and additions on the property. | Land | Improvement |
|---|---|---|---|---|
| 2025 | $8,288 | $337,210 | $56,250 | $280,960 |
| 2024 | $8,212 | $294,570 | $56,250 | $238,320 |
| 2023 | $8,170 | $294,570 | $56,250 | $238,320 |
| 2022 | $7,360 | $272,070 | $56,250 | $215,820 |
| 2021 | $7,360 | $272,070 | $56,250 | $215,820 |
| 2020 | $7,463 | $272,070 | $56,250 | $215,820 |
| 2019 | $10,229 | $257,950 | $56,250 | $201,700 |
| 2018 | $9,847 | $257,950 | $56,250 | $201,700 |
| 2017 | $9,718 | $244,420 | $56,250 | $188,170 |
| 2016 | $10,398 | $0 | $0 | $0 |
| 2015 | $9,580 | $0 | $0 | $0 |
| 2014 | $9,686 | $0 | $0 | $0 |
| 2013 | $10,290 | $0 | $0 | $0 |
| 2012 | -- | $248,300 | $93,600 | $154,700 |
Source: Public Records
Map
Nearby Homes