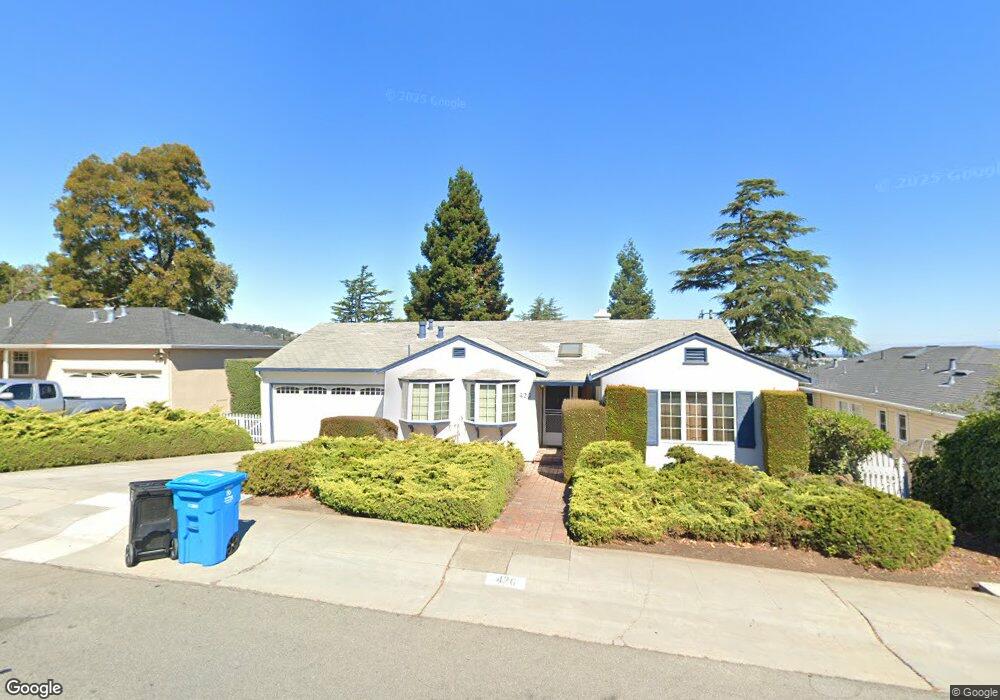
426 W 39th Ave Unit W San Mateo, CA 94403
Westwood Knolls NeighborhoodEstimated Value: $1,805,000 - $2,303,000
3
Beds
2
Baths
1,720
Sq Ft
$1,216/Sq Ft
Est. Value
About This Home
This home is located at 426 W 39th Ave Unit W, San Mateo, CA 94403 and is currently estimated at $2,091,352, approximately $1,215 per square foot. 426 W 39th Ave Unit W is a home located in San Mateo County with nearby schools including Laurel Elementary School, Abbott Middle School, and Hillsdale High School.
Ownership History
Date
Name
Owned For
Owner Type
Purchase Details
Closed on
Aug 9, 2013
Sold by
Idzal Mark T and Idzal Victoria E
Bought by
Idzal Mark Timothy and Idzal Victoria Elizabeth
Current Estimated Value
Purchase Details
Closed on
Jul 24, 1996
Sold by
Mcveigh Eileen M
Bought by
Idzal Mark T and Idzal Victoria E
Home Financials for this Owner
Home Financials are based on the most recent Mortgage that was taken out on this home.
Original Mortgage
$308,400
Outstanding Balance
$172,113
Interest Rate
6.82%
Estimated Equity
$1,919,239
Purchase Details
Closed on
Oct 12, 1994
Sold by
Mcveigh Terrence A and Mcveigh Eileen M
Bought by
Mcveigh Terrence A and Mcveigh Eileen M
Create a Home Valuation Report for This Property
The Home Valuation Report is an in-depth analysis detailing your home's value as well as a comparison with similar homes in the area
Home Values in the Area
Average Home Value in this Area
Purchase History
| Date | Buyer | Sale Price | Title Company |
|---|---|---|---|
| Idzal Mark Timothy | -- | None Available | |
| Idzal Mark T | $385,500 | Old Republic Title Company | |
| Mcveigh Terrence A | -- | -- |
Source: Public Records
Mortgage History
| Date | Status | Borrower | Loan Amount |
|---|---|---|---|
| Open | Idzal Mark T | $308,400 |
Source: Public Records
Tax History Compared to Growth
Tax History
| Year | Tax Paid | Tax Assessment Tax Assessment Total Assessment is a certain percentage of the fair market value that is determined by local assessors to be the total taxable value of land and additions on the property. | Land | Improvement |
|---|---|---|---|---|
| 2025 | $9,091 | $627,838 | $313,919 | $313,919 |
| 2023 | $9,091 | $603,460 | $301,730 | $301,730 |
| 2022 | $8,519 | $591,628 | $295,814 | $295,814 |
| 2021 | $8,309 | $580,028 | $290,014 | $290,014 |
| 2020 | $7,669 | $574,082 | $287,041 | $287,041 |
| 2019 | $7,844 | $562,826 | $281,413 | $281,413 |
| 2018 | $7,060 | $551,792 | $275,896 | $275,896 |
| 2017 | $6,631 | $540,974 | $270,487 | $270,487 |
| 2016 | $6,625 | $530,368 | $265,184 | $265,184 |
| 2015 | $6,415 | $522,402 | $261,201 | $261,201 |
| 2014 | $6,311 | $512,170 | $256,085 | $256,085 |
Source: Public Records
Map
Nearby Homes
- 3709 Kenwood Ave
- 417 36th Ave
- 413 36th Ave
- 3716 Kenwood Ave
- 312 W 39th Ave
- 330 41st Ave Unit W
- 435 Voelker Dr
- 632 W 39th Ave
- 308 42nd Ave
- 308 Midvale Ave
- 708 Linda Ct
- 241 42nd Ave Unit W
- 217 W 40th Ave
- 740 Dalehurst Ave
- 0000 Alhambra Dr
- 000 Alhambra Dr
- 00 Alhambra Dr
- 0 Alhambra Dr Unit ML81990306
- 901 Laurelwood Dr
- 128 42nd Ave
- 430 W 39th Ave Unit W
- 422 W 39th Ave Unit W
- 427 W 38th Ave Unit W
- 3801 Alameda de Las Pulgas
- 423 W 38th Ave
- 429 W 39th Ave Unit W
- 433 W 39th Ave
- 418 W 39th Ave Unit W
- 425 W 39th Ave Unit W
- 419 W 38th Ave Unit W
- 3907 Alameda de Las Pulgas
- 420 Dolores Ct
- 414 W 39th Ave
- 421 W 39th Ave Unit W
- 415 W 38th Ave Unit W
- 426 W 38th Ave Unit W
- 426 Dolores Ct
- 3812 Alameda de Las Pulgas
- 412 Dolores Ct
- 430 W 38th Ave Unit W