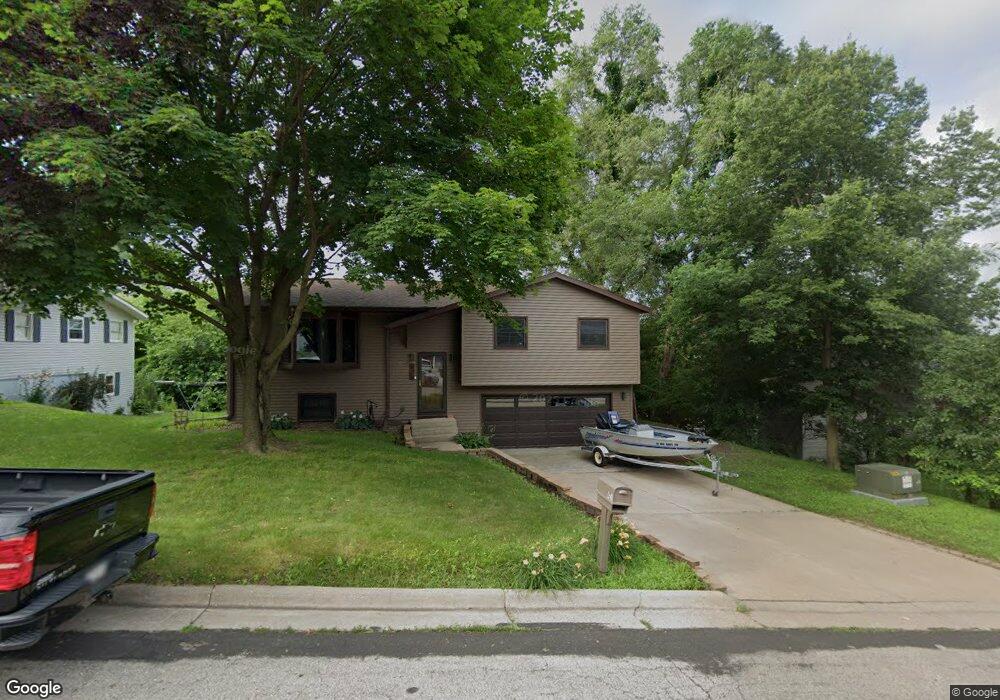
426 W Mchugh St Holmen, WI 54636
Estimated Value: $283,000 - $303,150
3
Beds
1
Bath
--
Sq Ft
0.31
Acres
About This Home
This home is located at 426 W Mchugh St, Holmen, WI 54636 and is currently estimated at $291,538. 426 W Mchugh St is a home located in La Crosse County with nearby schools including Holmen High School.
Ownership History
Date
Name
Owned For
Owner Type
Purchase Details
Closed on
Mar 18, 2016
Sold by
Holubar Nathan J and Meisch Holubar Nichole
Bought by
Schwabenbauer Charles R and Schwabenbauer Melissa T
Current Estimated Value
Home Financials for this Owner
Home Financials are based on the most recent Mortgage that was taken out on this home.
Original Mortgage
$161,912
Outstanding Balance
$126,947
Interest Rate
3.37%
Mortgage Type
FHA
Estimated Equity
$164,591
Purchase Details
Closed on
Oct 25, 2012
Sold by
Mdpj Llc
Bought by
Holubar Nathan J and Meisch Molubar Nichole
Home Financials for this Owner
Home Financials are based on the most recent Mortgage that was taken out on this home.
Original Mortgage
$136,350
Interest Rate
3.51%
Mortgage Type
VA
Purchase Details
Closed on
Nov 1, 2011
Sold by
Deutsche Bank National Trust Company
Bought by
Mdpj Llc
Purchase Details
Closed on
Jun 13, 2011
Sold by
Herold Michael S and Herold Teri L
Bought by
Deutsche Bank National Trust Company
Create a Home Valuation Report for This Property
The Home Valuation Report is an in-depth analysis detailing your home's value as well as a comparison with similar homes in the area
Home Values in the Area
Average Home Value in this Area
Purchase History
| Date | Buyer | Sale Price | Title Company |
|---|---|---|---|
| Schwabenbauer Charles R | $164,900 | River Valley Title | |
| Holubar Nathan J | $133,500 | New Castle Title | |
| Mdpj Llc | $82,000 | None Available | |
| Deutsche Bank National Trust Company | $129,190 | None Available |
Source: Public Records
Mortgage History
| Date | Status | Borrower | Loan Amount |
|---|---|---|---|
| Open | Schwabenbauer Charles R | $161,912 | |
| Previous Owner | Holubar Nathan J | $136,350 |
Source: Public Records
Tax History Compared to Growth
Tax History
| Year | Tax Paid | Tax Assessment Tax Assessment Total Assessment is a certain percentage of the fair market value that is determined by local assessors to be the total taxable value of land and additions on the property. | Land | Improvement |
|---|---|---|---|---|
| 2023 | $3,532 | $186,700 | $44,100 | $142,600 |
| 2022 | $3,583 | $186,700 | $44,100 | $142,600 |
| 2021 | $3,053 | $186,700 | $44,100 | $142,600 |
| 2020 | $3,257 | $186,700 | $44,100 | $142,600 |
| 2019 | $3,179 | $186,700 | $44,100 | $142,600 |
| 2018 | $3,017 | $142,700 | $27,500 | $115,200 |
| 2017 | $2,879 | $142,700 | $27,500 | $115,200 |
| 2016 | $2,915 | $133,600 | $27,500 | $106,100 |
| 2015 | $2,679 | $133,600 | $27,500 | $106,100 |
| 2014 | $2,739 | $133,600 | $27,500 | $106,100 |
| 2013 | $2,794 | $133,600 | $27,500 | $106,100 |
Source: Public Records
Map
Nearby Homes
- 347 Southern Dr
- 277 Southern Dr
- 270 Southern Dr
- LOT 13 W Ridge Estates
- 253 Southern Dr
- 356 Weston Rd
- 247 Southern Dr
- 240 Southern Dr
- LOT 14 W Ridge Estates
- 286 Weston Rd
- 251 Weston Rd
- Parcel A Wisconsin 35
- Parcel A + B Wisconsin 35
- 349 Weston Rd
- 230 Howard Dr
- 809 N Holmen Dr
- 124 Mill St
- Lot 5 Hawkeye Business Park -
- Lot 12 Hawkeye Business Park -
- Lt2 Wisconsin 35
- 416 W Mchugh St
- 429 W Mchugh St
- 430 W Mchugh St
- 404 W Mchugh St
- 404 McHugh Street West St W
- 501 W Mchugh St
- 405 Hillcrest Dr
- 340 W Mchugh St
- 419 W Mchugh St
- 425 Lee St
- 417 W Mchugh St
- 427 Lee St
- 423 Lee St
- 429 Lee St
- 503 Duffs Ave
- 413 W Mchugh St Unit 413
- 328 W Mchugh St
- 426 Lee St
- 308 Park St
- 327 W Mchugh St