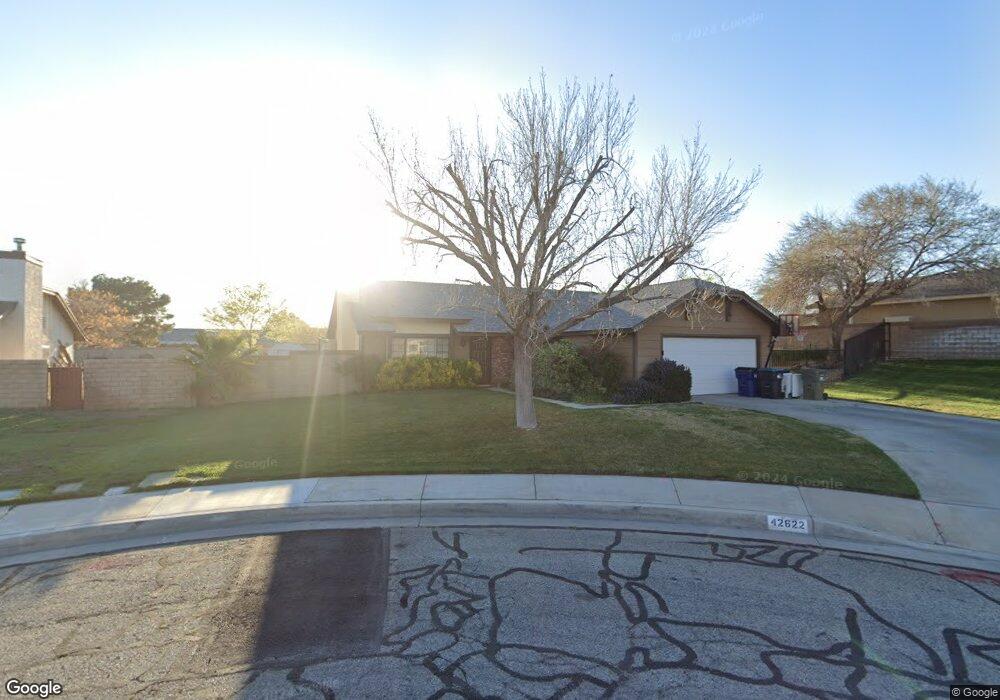
42622 Calandri Ln Lancaster, CA 93536
West Lancaster NeighborhoodEstimated Value: $426,000 - $771,000
3
Beds
2
Baths
1,452
Sq Ft
$365/Sq Ft
Est. Value
About This Home
This home is located at 42622 Calandri Ln, Lancaster, CA 93536 and is currently estimated at $530,052, approximately $365 per square foot. 42622 Calandri Ln is a home located in Los Angeles County with nearby schools including Valley View Elementary School, Joe Walker Middle School, and Lancaster High School.
Ownership History
Date
Name
Owned For
Owner Type
Purchase Details
Closed on
Aug 22, 2024
Sold by
Salazar Raymond Paul and Obryant Stephan Louis
Bought by
Solorio Carlos A and Naranjo Martin E
Current Estimated Value
Purchase Details
Closed on
Feb 12, 2007
Sold by
Kliewer Glenn C
Bought by
Kliewer Glenn C and Kliewer Trust
Purchase Details
Closed on
Sep 16, 1997
Sold by
Federal Home Loan Mortgage Corporation
Bought by
Kliewer Glenn C
Home Financials for this Owner
Home Financials are based on the most recent Mortgage that was taken out on this home.
Original Mortgage
$85,000
Interest Rate
7.54%
Purchase Details
Closed on
Jul 21, 1997
Sold by
Wendover Funding Inc
Bought by
Federal Home Loan Mortgage Corporation
Home Financials for this Owner
Home Financials are based on the most recent Mortgage that was taken out on this home.
Original Mortgage
$85,000
Interest Rate
7.54%
Purchase Details
Closed on
Jul 15, 1997
Sold by
Lopez Amelia R and Wendover Funding Inc
Bought by
Wendover Funding Inc
Create a Home Valuation Report for This Property
The Home Valuation Report is an in-depth analysis detailing your home's value as well as a comparison with similar homes in the area
Home Values in the Area
Average Home Value in this Area
Purchase History
| Date | Buyer | Sale Price | Title Company |
|---|---|---|---|
| Solorio Carlos A | $750,000 | Monarch Title | |
| Kliewer Glenn C | -- | None Available | |
| Kliewer Glenn C | $89,500 | -- | |
| Federal Home Loan Mortgage Corporation | -- | United Independent Title | |
| Wendover Funding Inc | $81,000 | United Independent Title |
Source: Public Records
Mortgage History
| Date | Status | Borrower | Loan Amount |
|---|---|---|---|
| Previous Owner | Kliewer Glenn C | $85,000 |
Source: Public Records
Tax History Compared to Growth
Tax History
| Year | Tax Paid | Tax Assessment Tax Assessment Total Assessment is a certain percentage of the fair market value that is determined by local assessors to be the total taxable value of land and additions on the property. | Land | Improvement |
|---|---|---|---|---|
| 2025 | $3,210 | $150,908 | $28,566 | $122,342 |
| 2024 | $3,210 | $147,950 | $28,006 | $119,944 |
| 2023 | $3,172 | $145,050 | $27,457 | $117,593 |
| 2022 | $2,990 | $142,207 | $26,919 | $115,288 |
| 2021 | $2,606 | $139,420 | $26,392 | $113,028 |
| 2019 | $2,549 | $135,287 | $25,610 | $109,677 |
| 2018 | $2,517 | $132,635 | $25,108 | $107,527 |
| 2016 | $2,396 | $127,486 | $24,134 | $103,352 |
| 2015 | $2,372 | $125,572 | $23,772 | $101,800 |
| 2014 | $2,382 | $123,113 | $23,307 | $99,806 |
Source: Public Records
Map
Nearby Homes
- 42662 28th St W
- 42545 30th St W
- 42719 30th St W
- 2706 W Avenue l4
- 42626 32nd St W
- 0 Corner of 27th St W and L
- 3137 Peachwood Dr
- 30 W Cor 30th Stw Ave Unit L8
- 3143 Peachwood Dr
- 42926 Pearlwood Dr
- 42935 Lemonwood Dr
- 3224 W Avenue L
- 42634 25th St W
- 3122 Softwood Ct
- 42962 Burlwood Dr
- 2835 W Avenue k12 Unit 202
- 2827 W Avenue k12 Unit 211
- 2833 W Avenue k12 Unit 232
- 2823 W Avenue k12 Unit 136
- 2823 W Avenue K 12 Unit 138
- 42630 Calandri Ln
- 2825 W Avenue l4
- 2831 W Avenue l4
- 2817 W Avenue l4
- 2839 W Avenue l4
- 42640 Calandri Ln
- 42623 28th St W
- 42629 28th St W
- 42623 Calandri Ln
- 42635 28th St W
- 2809 W Avenue l4
- 2847 W Avenue l4
- 42629 Calandri Ln
- 42637 Calandri Ln
- 2801 W Avenue l4
- 2855 W Avenue l4
- 42643 Calandri Ln
- 2763 W Avenue l4
- 2823 Calandri Ln
- 2831 Calandri Ln