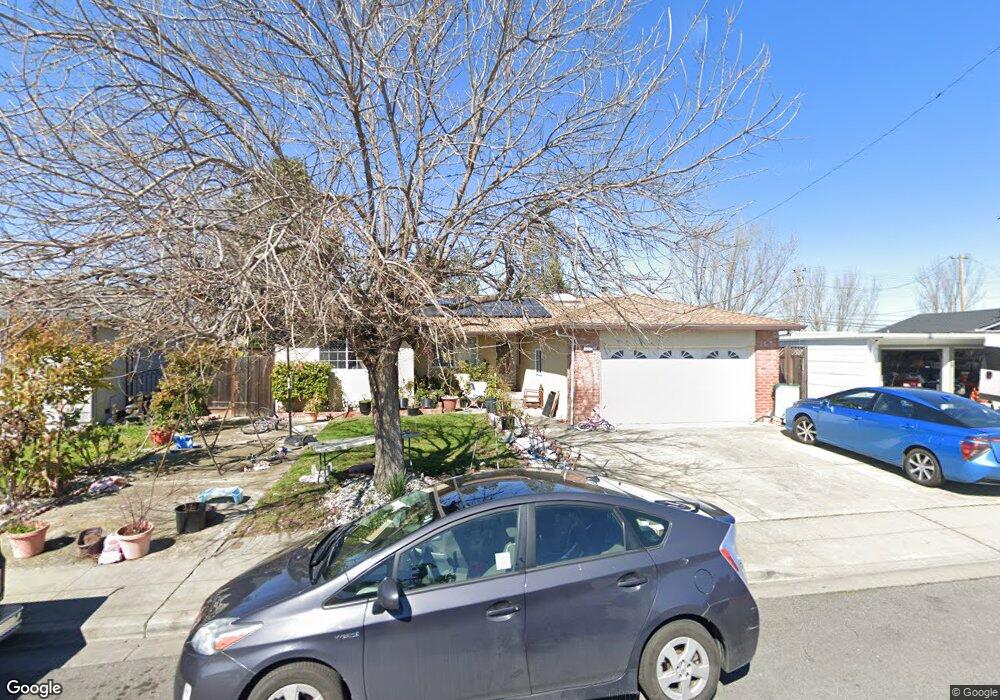
42629 Queens Park Ct Fremont, CA 94538
Blacow NeighborhoodEstimated Value: $1,432,000 - $1,571,000
4
Beds
2
Baths
1,535
Sq Ft
$984/Sq Ft
Est. Value
About This Home
This home is located at 42629 Queens Park Ct, Fremont, CA 94538 and is currently estimated at $1,511,196, approximately $984 per square foot. 42629 Queens Park Ct is a home located in Alameda County with nearby schools including Steven Millard Elementary, G.M. Walters Middle School, and John F. Kennedy High School.
Ownership History
Date
Name
Owned For
Owner Type
Purchase Details
Closed on
Aug 10, 2020
Sold by
Krishnamurthy Balachander and Padmanabhan Urmila
Bought by
Krishnamurthy Balachander and Padmanabhan Urmila
Current Estimated Value
Purchase Details
Closed on
Nov 5, 2009
Sold by
Pun Alan
Bought by
Krishnamurthy Balachander and Padmanabhan Urmila
Home Financials for this Owner
Home Financials are based on the most recent Mortgage that was taken out on this home.
Original Mortgage
$405,000
Interest Rate
4.92%
Mortgage Type
New Conventional
Purchase Details
Closed on
Apr 4, 2006
Sold by
Kanugula Bala M and Gorle Tanuja
Bought by
Pun Alan
Home Financials for this Owner
Home Financials are based on the most recent Mortgage that was taken out on this home.
Original Mortgage
$535,200
Interest Rate
6.25%
Mortgage Type
Fannie Mae Freddie Mac
Purchase Details
Closed on
Jun 30, 2005
Sold by
Kanugula Ramesh
Bought by
Kanugula Bala M and Gorle Tanuja
Purchase Details
Closed on
Oct 31, 2002
Sold by
Kanugula Prasad K
Bought by
Kanugula Bala M and Gorle Tanuja
Home Financials for this Owner
Home Financials are based on the most recent Mortgage that was taken out on this home.
Original Mortgage
$370,000
Interest Rate
5%
Purchase Details
Closed on
Oct 17, 2001
Sold by
Kanugula Bala M and Gorle Tanuja
Bought by
Kanugula Bala M and Gorle Tanuja
Home Financials for this Owner
Home Financials are based on the most recent Mortgage that was taken out on this home.
Original Mortgage
$372,000
Interest Rate
6.37%
Purchase Details
Closed on
Jan 11, 2001
Sold by
Lonchar Monica
Bought by
Kanugula Bala M and Gorle Tanuja
Home Financials for this Owner
Home Financials are based on the most recent Mortgage that was taken out on this home.
Original Mortgage
$370,400
Interest Rate
7.25%
Purchase Details
Closed on
Dec 6, 1999
Sold by
Renville Jeffrey J and Renville Maryann
Bought by
Lonchar Monica
Home Financials for this Owner
Home Financials are based on the most recent Mortgage that was taken out on this home.
Original Mortgage
$185,000
Interest Rate
7.82%
Mortgage Type
Stand Alone First
Purchase Details
Closed on
Dec 15, 1994
Sold by
Greene Maureen G
Bought by
Renville Jeffrey J and Renville Maryann
Home Financials for this Owner
Home Financials are based on the most recent Mortgage that was taken out on this home.
Original Mortgage
$192,850
Interest Rate
5.75%
Create a Home Valuation Report for This Property
The Home Valuation Report is an in-depth analysis detailing your home's value as well as a comparison with similar homes in the area
Home Values in the Area
Average Home Value in this Area
Purchase History
| Date | Buyer | Sale Price | Title Company |
|---|---|---|---|
| Krishnamurthy Balachander | -- | None Available | |
| Krishnamurthy Balachander | $450,000 | Orange Coast Title | |
| Pun Alan | $669,000 | Financial Title Company | |
| Kanugula Bala M | -- | Ticor Title Company Of Ca | |
| Kanugula Bala M | $124,000 | Fidelity National Title Co | |
| Kanugula Bala M | $155,000 | American Title Co | |
| Kanugula Bala M | $463,000 | Placer Title Company | |
| Lonchar Monica | $335,000 | Chicago Title Co | |
| Renville Jeffrey J | $203,000 | North American Title Company |
Source: Public Records
Mortgage History
| Date | Status | Borrower | Loan Amount |
|---|---|---|---|
| Previous Owner | Krishnamurthy Balachander | $405,000 | |
| Previous Owner | Pun Alan | $535,200 | |
| Previous Owner | Kanugula Bala M | $370,000 | |
| Previous Owner | Kanugula Bala M | $372,000 | |
| Previous Owner | Kanugula Bala M | $370,400 | |
| Previous Owner | Lonchar Monica | $185,000 | |
| Previous Owner | Renville Jeffrey J | $192,850 |
Source: Public Records
Tax History Compared to Growth
Tax History
| Year | Tax Paid | Tax Assessment Tax Assessment Total Assessment is a certain percentage of the fair market value that is determined by local assessors to be the total taxable value of land and additions on the property. | Land | Improvement |
|---|---|---|---|---|
| 2025 | $7,415 | $593,390 | $174,248 | $426,142 |
| 2024 | $7,415 | $581,622 | $170,833 | $417,789 |
| 2023 | $7,209 | $570,081 | $167,483 | $409,598 |
| 2022 | $7,106 | $558,768 | $164,200 | $401,568 |
| 2021 | $6,933 | $547,680 | $160,982 | $393,698 |
| 2020 | $6,921 | $548,995 | $159,332 | $389,663 |
| 2019 | $6,754 | $530,584 | $156,208 | $374,376 |
| 2018 | $6,620 | $520,184 | $153,146 | $367,038 |
| 2017 | $6,454 | $509,986 | $150,144 | $359,842 |
| 2016 | $6,339 | $499,990 | $147,201 | $352,789 |
| 2015 | $6,249 | $492,483 | $144,991 | $347,492 |
| 2014 | $6,138 | $482,840 | $142,152 | $340,688 |
Source: Public Records
Map
Nearby Homes
- 4860 Bryce Canyon Park Dr
- 5341 Audubon Park Ct
- 4537 Capewood Terrace
- 4533 Capewood Terrace
- 4751 Wadsworth Ct
- 43163 Grimmer Terrace
- 42932 Peachwood St
- 40696 Robin St
- 40422 Landon Ave
- 4309 Bora Ave
- 41882 Gifford St
- 48 Eagle Green
- 5560 Boscell Common
- 92 Delta Green
- 4840 Piper St
- 5580 Hemlock Terrace
- 262 Manitoba Green
- 4463 Hyde Common Unit 306
- 202 Manitoba Terrace
- 3923 Wildflower Common Unit 19
- 42623 Queens Park Ct
- 42635 Queens Park Ct
- 42617 Queens Park Ct
- 42641 Queens Park Ct
- 42646 Queens Park Ct
- 42654 Queens Park Ct
- 42638 Queens Park Ct
- 42611 Queens Park Ct
- 42647 Queens Park Ct
- 42662 Queens Park Ct
- 42630 Queens Park Ct
- 42653 Queens Park Ct
- 42605 Queens Park Ct
- 42675 Everglades Park Dr
- 42667 Everglades Park Dr
- 42683 Everglades Park Dr
- 42622 Queens Park Ct
- 42606 Queens Park Ct
- 42691 Everglades Park Dr
- 42659 Everglades Park Dr