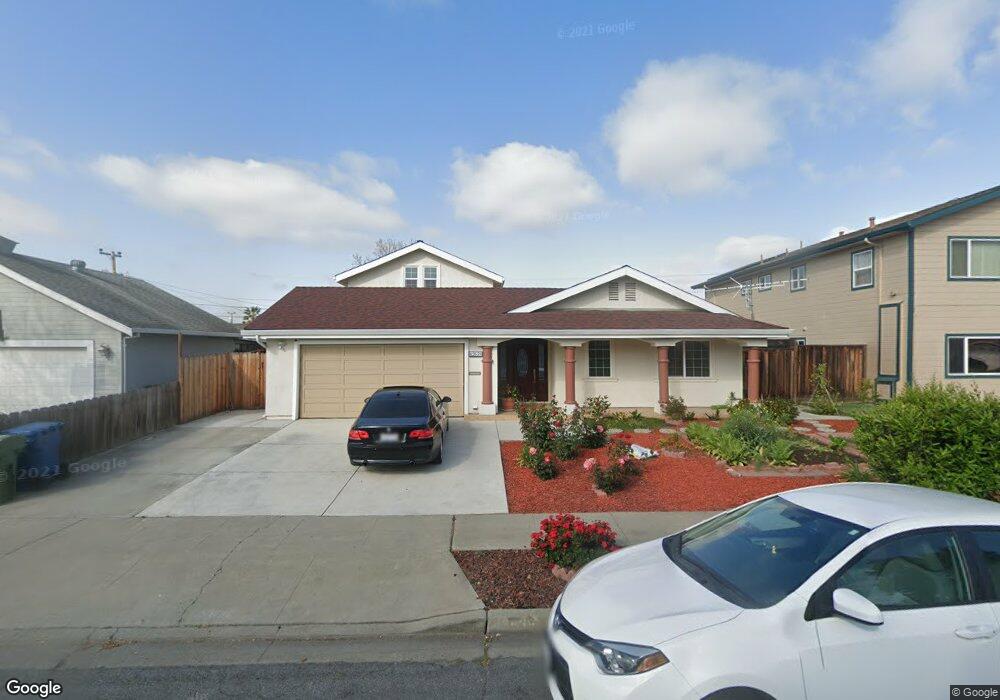
42639 Lemonwood St Fremont, CA 94538
Grimmer NeighborhoodEstimated Value: $1,156,000 - $1,735,756
3
Beds
2
Baths
1,198
Sq Ft
$1,248/Sq Ft
Est. Value
About This Home
This home is located at 42639 Lemonwood St, Fremont, CA 94538 and is currently estimated at $1,495,689, approximately $1,248 per square foot. 42639 Lemonwood St is a home located in Alameda County with nearby schools including Harvey Green Elementary School, John M. Horner Junior High School, and Irvington High School.
Ownership History
Date
Name
Owned For
Owner Type
Purchase Details
Closed on
Aug 20, 2015
Sold by
Eng Pa Nan and Eng Chen Yu Wo
Bought by
Pa Nan Eng & Chen Yu Wo Eng Revocable Tr
Current Estimated Value
Purchase Details
Closed on
May 25, 2011
Sold by
Eng Pa Nan and Eng Chen Yu Wo
Bought by
Eng Pa Nan and Eng Chen Yu Wo
Home Financials for this Owner
Home Financials are based on the most recent Mortgage that was taken out on this home.
Original Mortgage
$337,000
Outstanding Balance
$232,574
Interest Rate
4.73%
Mortgage Type
New Conventional
Estimated Equity
$1,263,115
Purchase Details
Closed on
Aug 13, 2009
Sold by
Schieder Brent T and Schieder Richard
Bought by
Yu Eng Pa Nan and Yu Wo Chen
Home Financials for this Owner
Home Financials are based on the most recent Mortgage that was taken out on this home.
Original Mortgage
$165,000
Interest Rate
5.09%
Mortgage Type
New Conventional
Purchase Details
Closed on
Aug 12, 2009
Sold by
Schieder Lana
Bought by
Schieder Richard
Home Financials for this Owner
Home Financials are based on the most recent Mortgage that was taken out on this home.
Original Mortgage
$165,000
Interest Rate
5.09%
Mortgage Type
New Conventional
Purchase Details
Closed on
Jun 29, 2009
Sold by
Guevarra Leo B
Bought by
Schieder Brent T and Schieder Richard
Home Financials for this Owner
Home Financials are based on the most recent Mortgage that was taken out on this home.
Original Mortgage
$165,000
Interest Rate
5.09%
Mortgage Type
New Conventional
Purchase Details
Closed on
Aug 28, 2006
Sold by
Christensen Michael J and Christensen Terri A
Bought by
Guevarra Leo B
Home Financials for this Owner
Home Financials are based on the most recent Mortgage that was taken out on this home.
Original Mortgage
$472,000
Interest Rate
6.75%
Mortgage Type
Purchase Money Mortgage
Purchase Details
Closed on
Aug 25, 2006
Sold by
Guevarra Joy
Bought by
Guevarra Leo B
Home Financials for this Owner
Home Financials are based on the most recent Mortgage that was taken out on this home.
Original Mortgage
$472,000
Interest Rate
6.75%
Mortgage Type
Purchase Money Mortgage
Purchase Details
Closed on
Dec 7, 1998
Sold by
Nicolaysen Dorothy V
Bought by
Christensen Michael J and Christensen Terri A
Home Financials for this Owner
Home Financials are based on the most recent Mortgage that was taken out on this home.
Original Mortgage
$190,000
Interest Rate
6.78%
Create a Home Valuation Report for This Property
The Home Valuation Report is an in-depth analysis detailing your home's value as well as a comparison with similar homes in the area
Home Values in the Area
Average Home Value in this Area
Purchase History
| Date | Buyer | Sale Price | Title Company |
|---|---|---|---|
| Pa Nan Eng & Chen Yu Wo Eng Revocable Tr | -- | None Available | |
| Eng Pa Nan | -- | None Available | |
| Eng Pa Nan | -- | Chicago Title Servicelink Di | |
| Yu Eng Pa Nan | $432,000 | Chicago Title Company | |
| Schieder Richard | -- | Chicago Title Company | |
| Schieder Brent T | -- | Chicago Title Company | |
| Schieder Brent T | $306,000 | None Available | |
| Guevarra Leo B | $590,000 | North American Title Co | |
| Guevarra Leo B | -- | North American Title Co | |
| Christensen Michael J | $200,000 | Fidelity National Title Co |
Source: Public Records
Mortgage History
| Date | Status | Borrower | Loan Amount |
|---|---|---|---|
| Open | Eng Pa Nan | $337,000 | |
| Closed | Yu Eng Pa Nan | $165,000 | |
| Previous Owner | Guevarra Leo B | $472,000 | |
| Previous Owner | Guevarra Leo B | $118,000 | |
| Previous Owner | Christensen Michael J | $190,000 |
Source: Public Records
Tax History Compared to Growth
Tax History
| Year | Tax Paid | Tax Assessment Tax Assessment Total Assessment is a certain percentage of the fair market value that is determined by local assessors to be the total taxable value of land and additions on the property. | Land | Improvement |
|---|---|---|---|---|
| 2025 | $8,801 | $718,025 | $167,278 | $550,747 |
| 2024 | $8,801 | $703,950 | $163,999 | $539,951 |
| 2023 | $8,563 | $690,149 | $160,784 | $529,365 |
| 2022 | $8,448 | $676,619 | $157,632 | $518,987 |
| 2021 | $8,243 | $663,356 | $154,542 | $508,814 |
| 2020 | $8,251 | $656,559 | $152,959 | $503,600 |
| 2019 | $8,159 | $643,687 | $149,960 | $493,727 |
| 2018 | $7,297 | $571,068 | $147,020 | $424,048 |
| 2017 | $6,413 | $499,461 | $144,138 | $355,323 |
| 2016 | $6,082 | $471,043 | $141,313 | $329,730 |
| 2015 | $5,997 | $463,971 | $139,191 | $324,780 |
| 2014 | $5,891 | $454,887 | $136,466 | $318,421 |
Source: Public Records
Map
Nearby Homes
- 42932 Peachwood St
- 4533 Capewood Terrace
- 4537 Capewood Terrace
- 43163 Grimmer Terrace
- 4309 Bora Ave
- 4860 Bryce Canyon Park Dr
- 41882 Gifford St
- 92 Delta Green
- 48 Eagle Green
- 5341 Audubon Park Ct
- 262 Manitoba Green
- 202 Manitoba Terrace
- 208 Manitoba Terrace
- 4751 Wadsworth Ct
- 261 Manitoba Green Unit 261
- 257 Manitoba Green
- 42759 Newport Dr
- 3923 Wildflower Common Unit 19
- 40696 Robin St
- 3872 Wildflower Common Unit 27
- 42657 Lemonwood St
- 42621 Lemonwood St
- 42681 Lemonwood St
- 42628 Shoreham Park Ct
- 42624 Shoreham Park Ct
- 42630 Shoreham Park Ct
- 42723 Lemonwood St
- 42555 Lemonwood St
- 42640 Lemonwood St
- 42658 Lemonwood St
- 42622 Lemonwood St
- 42622 Shoreham Park Ct
- 42632 Shoreham Park Ct
- 42741 Lemonwood St
- 42537 Lemonwood St
- 42724 Lemonwood St
- 4540 Seneca Park Ave
- 4550 Seneca Park Ave
- 42742 Lemonwood St
- 42759 Lemonwood St