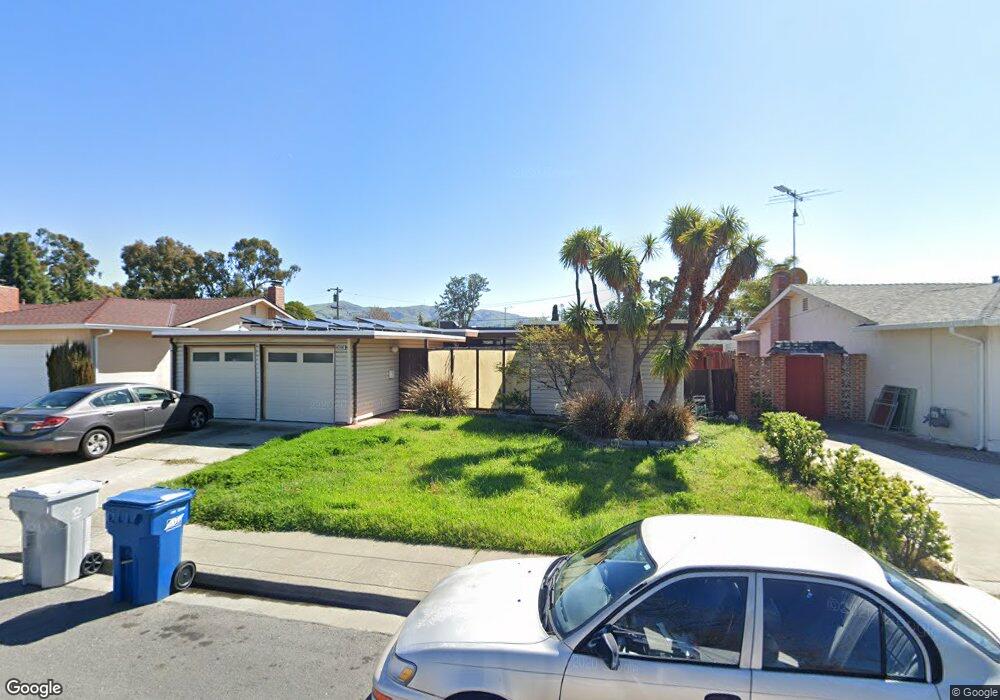
42646 Queens Park Ct Fremont, CA 94538
Blacow NeighborhoodEstimated Value: $1,393,000 - $1,613,000
3
Beds
2
Baths
1,466
Sq Ft
$1,037/Sq Ft
Est. Value
About This Home
This home is located at 42646 Queens Park Ct, Fremont, CA 94538 and is currently estimated at $1,520,464, approximately $1,037 per square foot. 42646 Queens Park Ct is a home located in Alameda County with nearby schools including Steven Millard Elementary, G.M. Walters Middle School, and John F. Kennedy High School.
Ownership History
Date
Name
Owned For
Owner Type
Purchase Details
Closed on
Jun 25, 2001
Sold by
Nuccio Scott S
Bought by
Nuccio Scott S and Nuccio Sandra
Current Estimated Value
Home Financials for this Owner
Home Financials are based on the most recent Mortgage that was taken out on this home.
Original Mortgage
$275,000
Outstanding Balance
$105,978
Interest Rate
7.14%
Estimated Equity
$1,414,486
Purchase Details
Closed on
Aug 31, 1998
Sold by
Nuccio Sandra L
Bought by
Nuccio Scott S
Home Financials for this Owner
Home Financials are based on the most recent Mortgage that was taken out on this home.
Original Mortgage
$192,750
Interest Rate
6.93%
Purchase Details
Closed on
Aug 27, 1998
Sold by
Ahumada Lisa A and Lopez Jose R
Bought by
Nuccio Scott S
Home Financials for this Owner
Home Financials are based on the most recent Mortgage that was taken out on this home.
Original Mortgage
$192,750
Interest Rate
6.93%
Create a Home Valuation Report for This Property
The Home Valuation Report is an in-depth analysis detailing your home's value as well as a comparison with similar homes in the area
Home Values in the Area
Average Home Value in this Area
Purchase History
| Date | Buyer | Sale Price | Title Company |
|---|---|---|---|
| Nuccio Scott S | -- | Fidelity National Title | |
| Nuccio Scott S | -- | First American Title Guarant | |
| Nuccio Scott S | $257,000 | First American Title Guarant |
Source: Public Records
Mortgage History
| Date | Status | Borrower | Loan Amount |
|---|---|---|---|
| Open | Nuccio Scott S | $275,000 | |
| Closed | Nuccio Scott S | $192,750 | |
| Closed | Nuccio Scott S | $38,550 | |
| Closed | Nuccio Scott S | $36,500 |
Source: Public Records
Tax History Compared to Growth
Tax History
| Year | Tax Paid | Tax Assessment Tax Assessment Total Assessment is a certain percentage of the fair market value that is determined by local assessors to be the total taxable value of land and additions on the property. | Land | Improvement |
|---|---|---|---|---|
| 2025 | $5,222 | $395,877 | $120,863 | $282,014 |
| 2024 | $5,222 | $387,980 | $118,494 | $276,486 |
| 2023 | $5,069 | $387,237 | $116,171 | $271,066 |
| 2022 | $4,986 | $372,644 | $113,893 | $265,751 |
| 2021 | $4,867 | $365,201 | $111,660 | $260,541 |
| 2020 | $4,824 | $368,385 | $110,515 | $257,870 |
| 2019 | $4,772 | $361,164 | $108,349 | $252,815 |
| 2018 | $4,676 | $354,084 | $106,225 | $247,859 |
| 2017 | $4,558 | $347,141 | $104,142 | $242,999 |
| 2016 | $4,471 | $340,337 | $102,101 | $238,236 |
| 2015 | $4,403 | $335,224 | $100,567 | $234,657 |
| 2014 | $4,320 | $328,658 | $98,597 | $230,061 |
Source: Public Records
Map
Nearby Homes
- 4860 Bryce Canyon Park Dr
- 5341 Audubon Park Ct
- 42606 Fontainebleau Park Ln
- 4537 Capewood Terrace
- 4533 Capewood Terrace
- 4751 Wadsworth Ct
- 43163 Grimmer Terrace
- 40422 Landon Ave
- 40696 Robin St
- 42932 Peachwood St
- 4309 Bora Ave
- 41882 Gifford St
- 48 Eagle Green
- 5560 Boscell Common
- 4840 Piper St
- 92 Delta Green
- 5580 Hemlock Terrace
- 4463 Hyde Common Unit 306
- 262 Manitoba Green
- 3923 Wildflower Common Unit 19
- 42638 Queens Park Ct
- 42654 Queens Park Ct
- 42675 Everglades Park Dr
- 42630 Queens Park Ct
- 42667 Everglades Park Dr
- 42662 Queens Park Ct
- 42683 Everglades Park Dr
- 42629 Queens Park Ct
- 42623 Queens Park Ct
- 42659 Everglades Park Dr
- 42635 Queens Park Ct
- 42617 Queens Park Ct
- 42641 Queens Park Ct
- 42622 Queens Park Ct
- 42691 Everglades Park Dr
- 42651 Everglades Park Dr
- 42647 Queens Park Ct
- 42611 Queens Park Ct
- 42653 Queens Park Ct
- 42614 Queens Park Ct