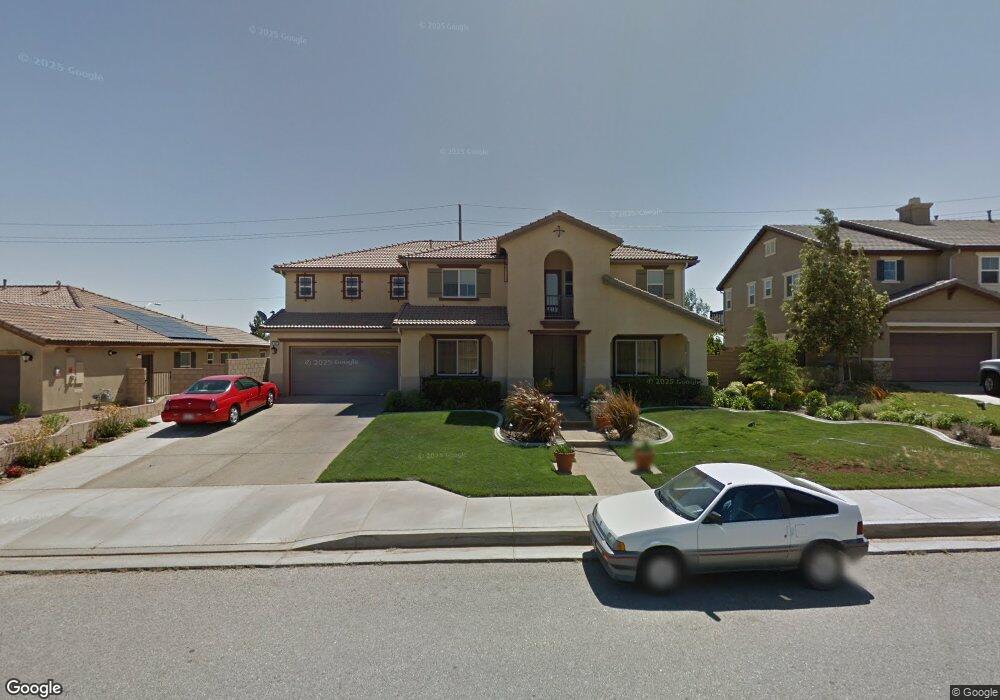
42652 Camden Way Lancaster, CA 93536
West Lancaster NeighborhoodEstimated Value: $693,745 - $840,000
5
Beds
3
Baths
4,096
Sq Ft
$183/Sq Ft
Est. Value
About This Home
This home is located at 42652 Camden Way, Lancaster, CA 93536 and is currently estimated at $749,436, approximately $182 per square foot. 42652 Camden Way is a home located in Los Angeles County with nearby schools including Del Sur Senior Elementary School, Quartz Hill High School, and Fabunni Private School Inc..
Ownership History
Date
Name
Owned For
Owner Type
Purchase Details
Closed on
Aug 18, 2020
Sold by
Thomas Kenneth E and Thomas Paula K
Bought by
Thomas Kenneth E and Thomas Paula K
Current Estimated Value
Home Financials for this Owner
Home Financials are based on the most recent Mortgage that was taken out on this home.
Original Mortgage
$523,906
Outstanding Balance
$463,875
Interest Rate
2.9%
Mortgage Type
VA
Estimated Equity
$285,561
Purchase Details
Closed on
Feb 19, 2010
Sold by
Thomas Kenneth E and Thomas Paula K
Bought by
Thomas Kenneth E
Home Financials for this Owner
Home Financials are based on the most recent Mortgage that was taken out on this home.
Original Mortgage
$367,500
Interest Rate
5.03%
Mortgage Type
VA
Purchase Details
Closed on
Sep 4, 2008
Sold by
Capital Pacific Holdings Llc
Bought by
Thomas S Kenneth E
Home Financials for this Owner
Home Financials are based on the most recent Mortgage that was taken out on this home.
Original Mortgage
$361,550
Interest Rate
6.04%
Mortgage Type
VA
Create a Home Valuation Report for This Property
The Home Valuation Report is an in-depth analysis detailing your home's value as well as a comparison with similar homes in the area
Home Values in the Area
Average Home Value in this Area
Purchase History
| Date | Buyer | Sale Price | Title Company |
|---|---|---|---|
| Thomas Kenneth E | -- | Stewart Title Guaranty Co | |
| Thomas Kenneth E | -- | Lawyers Title | |
| Thomas S Kenneth E | $350,000 | First American Title Company |
Source: Public Records
Mortgage History
| Date | Status | Borrower | Loan Amount |
|---|---|---|---|
| Open | Thomas Kenneth E | $523,906 | |
| Closed | Thomas Kenneth E | $367,500 | |
| Previous Owner | Thomas S Kenneth E | $361,550 |
Source: Public Records
Tax History Compared to Growth
Tax History
| Year | Tax Paid | Tax Assessment Tax Assessment Total Assessment is a certain percentage of the fair market value that is determined by local assessors to be the total taxable value of land and additions on the property. | Land | Improvement |
|---|---|---|---|---|
| 2025 | $11,644 | $450,700 | $90,135 | $360,565 |
| 2024 | $11,644 | $441,864 | $88,368 | $353,496 |
| 2023 | $11,482 | $433,201 | $86,636 | $346,565 |
| 2022 | $11,142 | $424,708 | $84,938 | $339,770 |
| 2021 | $10,593 | $416,381 | $83,273 | $333,108 |
| 2019 | $10,262 | $404,033 | $80,804 | $323,229 |
| 2018 | $10,095 | $396,112 | $79,220 | $316,892 |
| 2016 | $9,512 | $380,733 | $76,145 | $304,588 |
| 2015 | $9,367 | $375,015 | $75,002 | $300,013 |
| 2014 | $8,620 | $316,000 | $63,200 | $252,800 |
Source: Public Records
Map
Nearby Homes
- 42646 Raywood Dr
- 42617 Camden Way
- 0 Cor Ave L Pav 70th Stw Unit 22008217
- 0 W Avenue L-2
- 42547 Camden Way
- 42570 72nd St W
- 0 Avenue l6 Unit 21000051
- 0 72nd St W Unit 25002123
- 42428 Camden Way
- 42457 Valley Vista Dr
- 42432 72nd St W
- 42532 Marsuerite Way
- 42344 Camden Way
- 8150 Avenue L- 10
- 6533 W Avenue L
- 42240 Ridge View Dr
- 42257 Sand Palm Way
- 6533 W Avenue L-10
- 42164 Valley Vista Dr
- 42158 Valley Vista Dr
- 42644 Camden Way
- 42660 Camden Way
- 42636 Camden Way
- 42704 Camden Way
- 42655 Camden Way
- 42639 Camden Way
- 42628 Camden Way
- 42712 Camden Way
- 42631 Camden Way
- 7032 W Avenue l2
- 7032 W Avenue L-2
- 42620 Camden Way
- 42654 Raywood Dr
- 42638 Raywood Dr
- 42623 Camden Way
- 42630 Raywood Dr
- 7023 W Avenue L-2
- 7023 W Avenue a2
- 7023 W Avenue l2
- 7038 W Avenue L-2