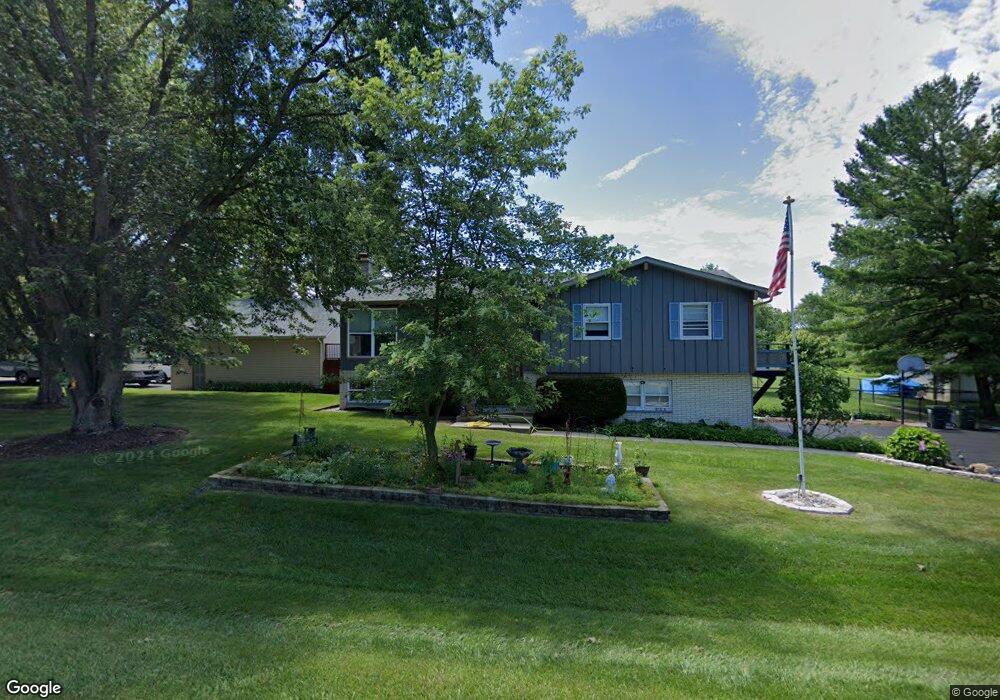
42655 N Berrong Ct Winthrop Harbor, IL 60096
Estimated Value: $349,762 - $373,000
--
Bed
3
Baths
1,296
Sq Ft
$277/Sq Ft
Est. Value
About This Home
This home is located at 42655 N Berrong Ct, Winthrop Harbor, IL 60096 and is currently estimated at $358,691, approximately $276 per square foot. 42655 N Berrong Ct is a home located in Lake County with nearby schools including Westfield School, North Prairie Junior High School, and Zion-Benton Township High School.
Ownership History
Date
Name
Owned For
Owner Type
Purchase Details
Closed on
Mar 29, 2001
Sold by
Holverson Scott G and Holverson Darcy D
Bought by
Smith Glenn and Teigland Amanda
Current Estimated Value
Home Financials for this Owner
Home Financials are based on the most recent Mortgage that was taken out on this home.
Original Mortgage
$193,410
Outstanding Balance
$71,351
Interest Rate
7.03%
Estimated Equity
$287,340
Purchase Details
Closed on
Jun 17, 1996
Sold by
Holverson Scott G
Bought by
Holverson Scott G and Holverson Darcy D
Home Financials for this Owner
Home Financials are based on the most recent Mortgage that was taken out on this home.
Original Mortgage
$152,454
Interest Rate
8.07%
Mortgage Type
FHA
Create a Home Valuation Report for This Property
The Home Valuation Report is an in-depth analysis detailing your home's value as well as a comparison with similar homes in the area
Home Values in the Area
Average Home Value in this Area
Purchase History
| Date | Buyer | Sale Price | Title Company |
|---|---|---|---|
| Smith Glenn | $215,000 | Collar Counties Title Plant | |
| Holverson Scott G | -- | -- | |
| Holverson Scott G | $156,000 | Attorneys Natl Title Network |
Source: Public Records
Mortgage History
| Date | Status | Borrower | Loan Amount |
|---|---|---|---|
| Open | Smith Glenn | $193,410 | |
| Previous Owner | Holverson Scott G | $152,454 |
Source: Public Records
Tax History Compared to Growth
Tax History
| Year | Tax Paid | Tax Assessment Tax Assessment Total Assessment is a certain percentage of the fair market value that is determined by local assessors to be the total taxable value of land and additions on the property. | Land | Improvement |
|---|---|---|---|---|
| 2024 | $9,127 | $101,702 | $14,518 | $87,184 |
| 2023 | $7,990 | $93,148 | $14,015 | $79,133 |
| 2022 | $7,990 | $79,004 | $13,764 | $65,240 |
| 2021 | $8,179 | $76,995 | $13,414 | $63,581 |
| 2020 | $7,933 | $73,476 | $12,801 | $60,675 |
| 2019 | $7,740 | $69,711 | $12,145 | $57,566 |
| 2018 | $4,609 | $77,376 | $14,838 | $62,538 |
| 2017 | $8,652 | $72,791 | $13,959 | $58,832 |
| 2016 | $8,432 | $69,298 | $13,289 | $56,009 |
| 2015 | $8,291 | $63,553 | $12,187 | $51,366 |
| 2014 | $7,367 | $64,705 | $12,867 | $51,838 |
| 2012 | $7,248 | $67,240 | $13,371 | $53,869 |
Source: Public Records
Map
Nearby Homes
- 3109 11th St
- 429 Megan Place
- 0 Garnett Ave
- 830 Russell Ave
- 3106 13th St
- 140 Old Darby Ln
- 42908 N Lewis Ave
- 0 13th St Unit MRD12432014
- 3015 13th St
- 1228 Pennsylvania Ave
- 242 Thompson Ave
- 43100 N Lewis Ave
- 919 Charles Ave
- 11279 W Russell Rd
- 2404 13th St
- 630 Whitney Ave
- 1810 5th St
- 832 Fulton Ave
- 0 14th St Unit MRD12502206
- 1405 Lewis Ave
- 42608 N Berrong Ct
- 42678 N Berrong Ct
- 42635 N Berrong Ct
- 42673 Washington Ave
- 42584 Berrong Ct
- 42584 N Berrong Ct
- 42661 N Berrong Ct
- 42578 N Berrong Ct
- 42703 Berrong Ave
- 42703 N Berrong Ct
- 42711 Washington Ave
- 42609 Washington Ave
- 3132 Frans Ct
- 42583 N Berrong Ave
- 725 English Ln
- 42736 N Berrong Ct
- 42567 Washington Ave
- 738 Roberts Rd
- 730 Roberts Rd
- 3133 Frans Ct