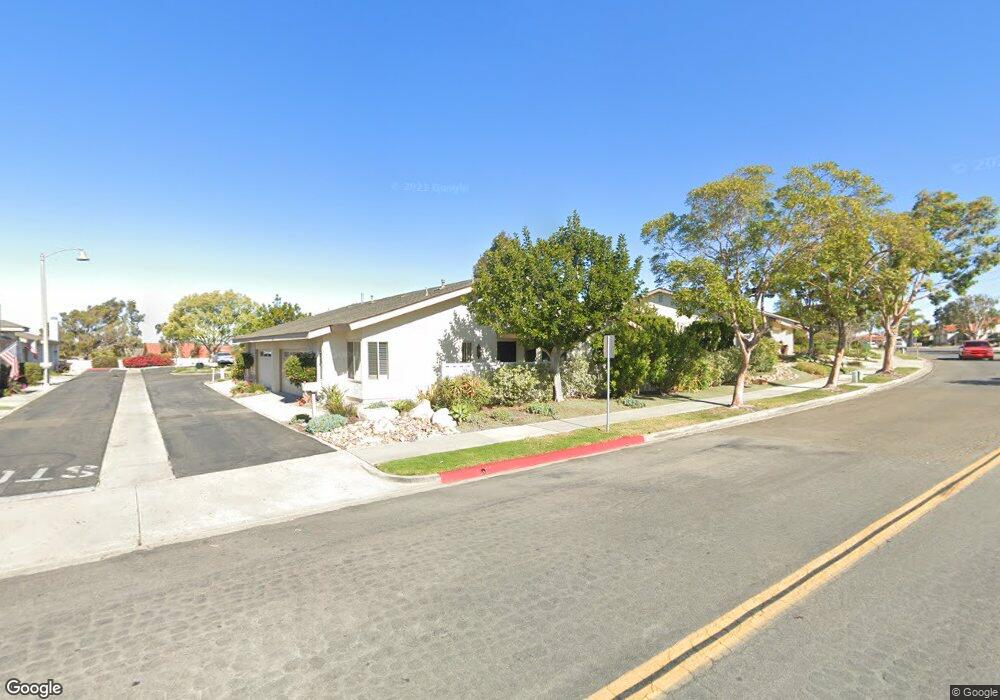
4266 Mirage Ln Oceanside, CA 92056
Lake NeighborhoodEstimated Value: $732,236 - $762,000
2
Beds
2
Baths
1,513
Sq Ft
$495/Sq Ft
Est. Value
About This Home
This home is located at 4266 Mirage Ln, Oceanside, CA 92056 and is currently estimated at $748,309, approximately $494 per square foot. 4266 Mirage Ln is a home located in San Diego County with nearby schools including Breeze Hill Elementary School, Madison Middle School, and Rancho Buena Vista High School.
Ownership History
Date
Name
Owned For
Owner Type
Purchase Details
Closed on
Mar 18, 2000
Sold by
Fry and Gloria
Bought by
Fry Kenneth E and Fry Cloria N
Current Estimated Value
Home Financials for this Owner
Home Financials are based on the most recent Mortgage that was taken out on this home.
Original Mortgage
$144,000
Outstanding Balance
$48,628
Interest Rate
8.24%
Estimated Equity
$699,681
Purchase Details
Closed on
Mar 13, 2000
Sold by
Fry Kenneth & Gloria Living Trust
Bought by
Shoup June Eleanor and Craft Lin L
Home Financials for this Owner
Home Financials are based on the most recent Mortgage that was taken out on this home.
Original Mortgage
$144,000
Outstanding Balance
$48,628
Interest Rate
8.24%
Estimated Equity
$699,681
Purchase Details
Closed on
Jan 12, 1999
Sold by
Fry Kenneth E and Frey Gloria M
Bought by
Kenneth & Gloria Fry Living Trust
Purchase Details
Closed on
Nov 6, 1997
Sold by
Kelso Family Trust 02-20-91 and Boone Laverna Boone
Bought by
Fry Kenneth E and Fry Gloria M
Home Financials for this Owner
Home Financials are based on the most recent Mortgage that was taken out on this home.
Original Mortgage
$90,000
Interest Rate
7.16%
Purchase Details
Closed on
Oct 18, 1991
Create a Home Valuation Report for This Property
The Home Valuation Report is an in-depth analysis detailing your home's value as well as a comparison with similar homes in the area
Home Values in the Area
Average Home Value in this Area
Purchase History
| Date | Buyer | Sale Price | Title Company |
|---|---|---|---|
| Fry Kenneth E | -- | First American Title | |
| Shoup June Eleanor | $180,000 | First American Title | |
| Kenneth & Gloria Fry Living Trust | -- | -- | |
| Fry Kenneth E | $150,000 | First American Title | |
| -- | $155,000 | -- |
Source: Public Records
Mortgage History
| Date | Status | Borrower | Loan Amount |
|---|---|---|---|
| Open | Shoup June Eleanor | $144,000 | |
| Previous Owner | Fry Kenneth E | $90,000 |
Source: Public Records
Tax History Compared to Growth
Tax History
| Year | Tax Paid | Tax Assessment Tax Assessment Total Assessment is a certain percentage of the fair market value that is determined by local assessors to be the total taxable value of land and additions on the property. | Land | Improvement |
|---|---|---|---|---|
| 2025 | $2,985 | $276,635 | $153,688 | $122,947 |
| 2024 | $2,985 | $271,212 | $150,675 | $120,537 |
| 2023 | $2,912 | $265,895 | $147,721 | $118,174 |
| 2022 | $2,905 | $260,682 | $144,825 | $115,857 |
| 2021 | $2,840 | $255,572 | $141,986 | $113,586 |
| 2020 | $2,831 | $252,953 | $140,531 | $112,422 |
| 2019 | $2,789 | $247,994 | $137,776 | $110,218 |
| 2018 | $2,652 | $243,132 | $135,075 | $108,057 |
| 2017 | $70 | $238,366 | $132,427 | $105,939 |
| 2016 | $2,540 | $233,693 | $129,831 | $103,862 |
| 2015 | $2,530 | $230,183 | $127,881 | $102,302 |
| 2014 | $2,469 | $225,675 | $125,376 | $100,299 |
Source: Public Records
Map
Nearby Homes
- 3579 Twilight Ln
- 200 Bright Creek Ln Unit 200
- 8 Blue Sky Ln
- 239 Havenview Ln
- 120 Brookside Ln
- 240 Havenview Ln
- 37 Havenview Ln
- 201 Bright Creek Ln
- 166 Horizon Ln
- 101 Havenview Ln
- 127 Brookside Ln
- 17 Blue Sky Ln
- 2130 Sunset Dr Unit SPC 21
- 2130 Sunset Dr Unit 99
- 3563 Turquoise Ln
- 2112 Sunset Dr
- 3960 Plateau Place
- 3458 Los Mochis Way
- 3414 Del Este Way
- 3423 Del Este Way
- 4262 Mirage Ln
- 3569 Sky Haven Ln
- 4270 Mirage Ln
- 3567 Sky Haven Ln
- 4274 Mirage Ln
- 3565 Sky Haven Ln
- 3584 Twilight Ln Unit 1
- 4287 Zenith Ln
- 3580 Twilight Ln
- 4291 Zenith Ln Unit 3
- 4293 Zenith Ln
- 3588 Twilight Ln
- 4269 Mirage Ln
- 3592 Twilight Ln
- 4265 Mirage Ln Unit 1
- 4261 Mirage Ln
- 4273 Mirage Ln
- 4308 Mirage Ln
- 4303 Shady Ln
- 4306 Shady Ln