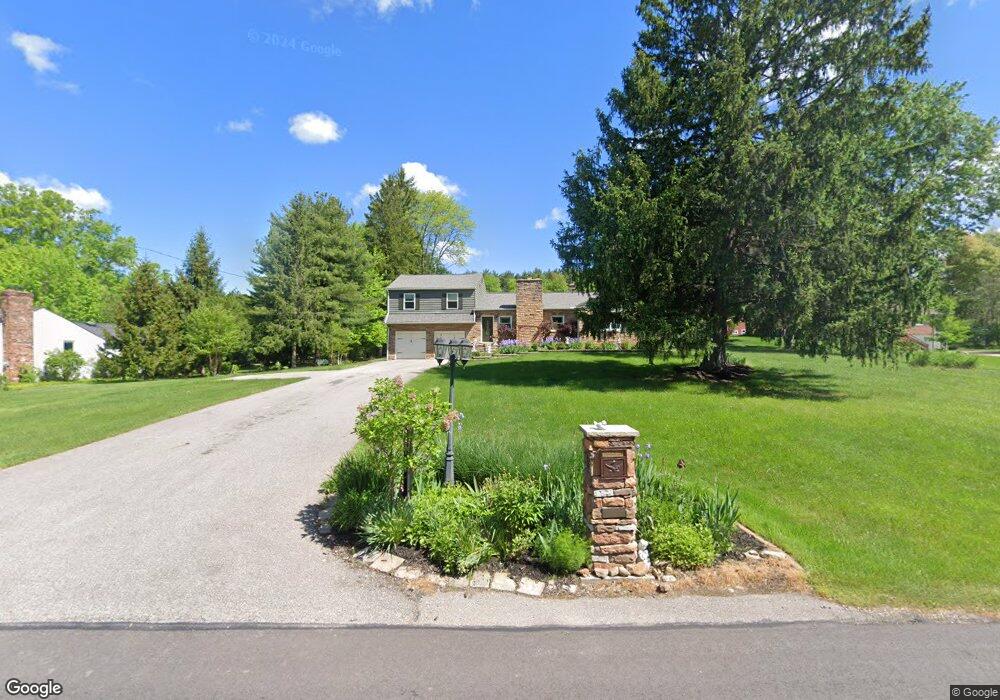
4267 Maple Dr Richfield, OH 44286
Estimated Value: $308,705 - $383,000
4
Beds
3
Baths
1,722
Sq Ft
$205/Sq Ft
Est. Value
About This Home
This home is located at 4267 Maple Dr, Richfield, OH 44286 and is currently estimated at $353,426, approximately $205 per square foot. 4267 Maple Dr is a home located in Summit County with nearby schools including Richfield Elementary School, Bath Elementary School, and Revere Middle School.
Ownership History
Date
Name
Owned For
Owner Type
Purchase Details
Closed on
Nov 22, 2021
Sold by
Osborne Deborah D and Dorsey Deborah Darlene
Bought by
Osborne Deborah D
Current Estimated Value
Home Financials for this Owner
Home Financials are based on the most recent Mortgage that was taken out on this home.
Original Mortgage
$139,000
Outstanding Balance
$126,750
Interest Rate
3.09%
Mortgage Type
New Conventional
Estimated Equity
$226,676
Purchase Details
Closed on
Apr 30, 2014
Sold by
Dorsey Walter Paul and Dorsey Deborah Darlene
Bought by
Dorsey Deborah Darlene
Purchase Details
Closed on
Jan 17, 2001
Sold by
Darlene Ziska Deborah D and Darlene Deborah
Bought by
Dorsey Walter Paul and Dorsey Deborah Darlene
Create a Home Valuation Report for This Property
The Home Valuation Report is an in-depth analysis detailing your home's value as well as a comparison with similar homes in the area
Home Values in the Area
Average Home Value in this Area
Purchase History
| Date | Buyer | Sale Price | Title Company |
|---|---|---|---|
| Osborne Deborah D | -- | None Listed On Document | |
| Dorsey Deborah Darlene | -- | None Available | |
| Dorsey Walter Paul | -- | -- |
Source: Public Records
Mortgage History
| Date | Status | Borrower | Loan Amount |
|---|---|---|---|
| Open | Osborne Deborah D | $139,000 |
Source: Public Records
Tax History
| Year | Tax Paid | Tax Assessment Tax Assessment Total Assessment is a certain percentage of the fair market value that is determined by local assessors to be the total taxable value of land and additions on the property. | Land | Improvement |
|---|---|---|---|---|
| 2025 | $4,047 | $94,234 | $16,513 | $77,721 |
| 2024 | $4,047 | $94,234 | $16,513 | $77,721 |
| 2023 | $4,047 | $94,234 | $16,513 | $77,721 |
| 2022 | $3,774 | $77,315 | $13,538 | $63,777 |
| 2021 | $3,777 | $77,315 | $13,538 | $63,777 |
| 2020 | $3,688 | $77,320 | $13,540 | $63,780 |
| 2019 | $2,782 | $54,670 | $15,620 | $39,050 |
| 2018 | $2,750 | $54,670 | $15,620 | $39,050 |
| 2017 | $2,796 | $54,670 | $15,620 | $39,050 |
| 2016 | $2,928 | $54,670 | $15,620 | $39,050 |
| 2015 | $2,796 | $54,670 | $15,620 | $39,050 |
| 2014 | $2,777 | $54,670 | $15,620 | $39,050 |
| 2013 | $2,822 | $58,310 | $15,620 | $42,690 |
Source: Public Records
Map
Nearby Homes
- 2941 Southern Rd
- 2370 N Cleveland Massillon Rd
- 3906 Everett Rd
- 3582 W Glencoe Rd
- 3454 Skye Ridge Dr
- 3521 Hamilton Dr
- 3814 Faith Ln Unit 1
- 3526 Crawford Dr
- 3860 Sawbridge Dr Unit 21
- 3797 Stewart Ct
- 3123 Aviemore Way
- 5179 W Streetsboro Rd
- 2250 Candlewood Ln
- V/L Brecksville Rd
- 1282 Ledgewood Dr
- 4699 W Bath Rd
- 3175 W Streetsboro Rd
- 967 Robinwood Hills Dr
- 3621 Seven Oaks Trail
- 3863 Granger Rd
Your Personal Tour Guide
Ask me questions while you tour the home.