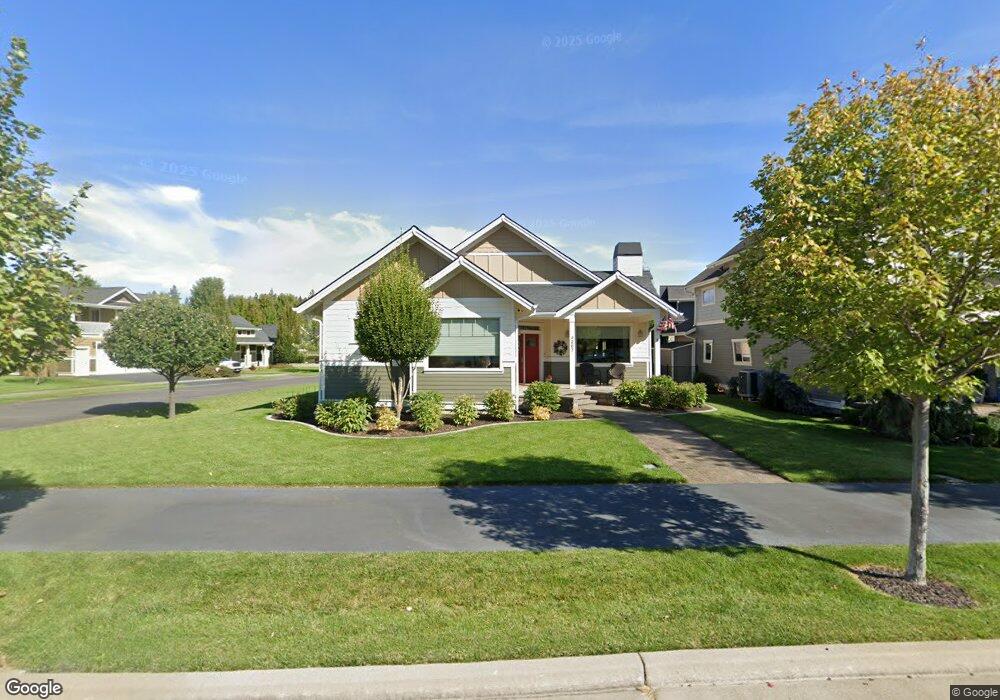
4267 W Shoreview Ln Coeur D'Alene, ID 83814
Spokane River District NeighborhoodEstimated Value: $1,062,000 - $1,263,000
3
Beds
3
Baths
2,356
Sq Ft
$487/Sq Ft
Est. Value
About This Home
This home is located at 4267 W Shoreview Ln, Coeur D'Alene, ID 83814 and is currently estimated at $1,146,745, approximately $486 per square foot. 4267 W Shoreview Ln is a home located in Kootenai County with nearby schools including Winton Elementary School, Lakes Magnet Middle School, and Lake City High School.
Ownership History
Date
Name
Owned For
Owner Type
Purchase Details
Closed on
May 10, 2019
Sold by
Marilyn Weber Living Trust
Bought by
Vinson Sidney B and Vinson Linda M
Current Estimated Value
Purchase Details
Closed on
Aug 24, 2018
Sold by
Weber Bernard L and Weber Marilyn R
Bought by
Weber Marilyn and Marilyn Weber Living Trust
Purchase Details
Closed on
Apr 13, 2016
Sold by
Coach Properties Llc
Bought by
Weber Family Trust
Purchase Details
Closed on
Sep 24, 2015
Sold by
Weber Bernie and Weber Marilyn
Bought by
Coach Properties Llc
Purchase Details
Closed on
Sep 29, 2014
Sold by
Minor William E and Minor Nancy G
Bought by
Weber Bernie and Weber Marilyn
Purchase Details
Closed on
Oct 21, 2011
Sold by
Lighthouse Group Inc
Bought by
Minor William E and Minor Nancy G
Purchase Details
Closed on
Aug 6, 2011
Sold by
Nighborhood Inc
Bought by
Lighthouse Group Inc
Create a Home Valuation Report for This Property
The Home Valuation Report is an in-depth analysis detailing your home's value as well as a comparison with similar homes in the area
Home Values in the Area
Average Home Value in this Area
Purchase History
| Date | Buyer | Sale Price | Title Company |
|---|---|---|---|
| Vinson Sidney B | -- | Kootenai County Title Co | |
| Weber Marilyn | -- | Kootenai County Title Co | |
| Weber Family Trust | -- | Accommodation | |
| Coach Properties Llc | -- | Accommodation | |
| Weber Bernie | -- | Kootenai County Title Co | |
| Minor William E | -- | -- | |
| Lighthouse Group Inc | -- | -- |
Source: Public Records
Tax History Compared to Growth
Tax History
| Year | Tax Paid | Tax Assessment Tax Assessment Total Assessment is a certain percentage of the fair market value that is determined by local assessors to be the total taxable value of land and additions on the property. | Land | Improvement |
|---|---|---|---|---|
| 2025 | $4,851 | $1,144,770 | $580,000 | $564,770 |
| 2024 | $4,542 | $1,072,200 | $505,000 | $567,200 |
| 2023 | $4,542 | $1,154,593 | $525,000 | $629,593 |
| 2022 | $5,275 | $1,150,952 | $493,000 | $657,952 |
| 2021 | $5,270 | $751,560 | $290,000 | $461,560 |
| 2020 | $4,465 | $617,580 | $241,500 | $376,080 |
| 2019 | $5,869 | $561,330 | $210,000 | $351,330 |
| 2018 | $6,356 | $544,930 | $210,000 | $334,930 |
| 2017 | $6,682 | $526,618 | $210,000 | $316,618 |
| 2016 | $6,621 | $495,412 | $210,000 | $285,412 |
| 2015 | $3,393 | $492,981 | $196,650 | $296,331 |
| 2013 | $2,985 | $476,808 | $207,000 | $269,808 |
Source: Public Records
Map
Nearby Homes
- 4445 Greenchain Loop Unit 2
- 4083 W Shoreview Ln
- 4444 Greenchain Loop Unit 3
- 4580 Greenchain Loop Unit 1
- 4467 Greenchain Loop Unit 1
- 3222 N Grandmill Ln Unit 103
- 3222 N Grandmill Ln Unit 101
- 3222 N Grandmill Ln Unit 102
- 3226 N Grandmill Ln Unit 103
- 3990 W Shoreview Ln
- 3922 W Shoreview Ln
- 4539 Greenchain Loop Unit 5
- Ash Plan at Grand Mill
- Onyx Plan at Grand Mill
- 3276 N Grandmill Ln Unit 101
- 3276 N Grandmill Ln Unit 103
- 4583 Greenchain Loop Unit 6
- 4752 Kona
- 4708 Kona
- 4745 W Kona Dr
- 4249 W Shoreview Ln
- 4464 W Woodhaven Loop
- 4301 W Shoreview Ln
- 4448 W Woodhaven Loop
- 4483 W Woodhaven Loop
- 4211 W Shoreview Ln
- 4321 W Shoreview Ln
- 4463 W Woodhaven Loop
- 4432 W Woodhaven Loop
- 4447 W Woodhaven Loop
- 4187 W Shoreview Ln
- 3259 N Waterwood Ln
- 4429 W Woodhaven Loop
- 4414 W Woodhaven Loop
- 4413 Woodhaven
- 3279 N Waterwood Ln
- 4413 W Woodhaven Loop
- 4452 Riverway
- 3299 N Waterwood Ln
- 4449 W Greenchain Loop #3