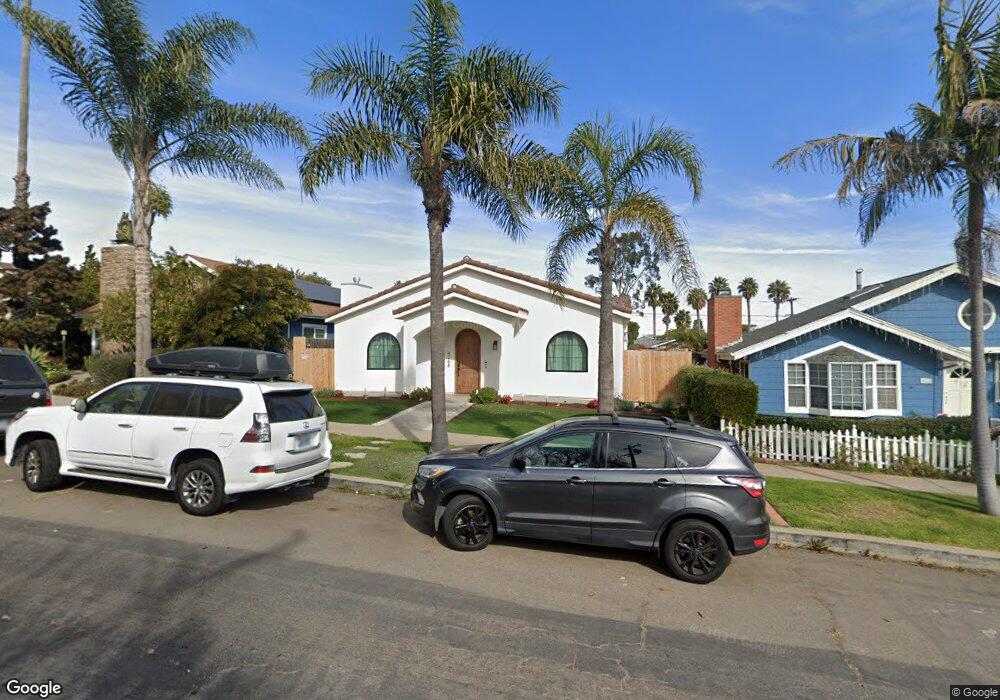
4268 Orchard Ave San Diego, CA 92107
Point Loma Heights NeighborhoodEstimated Value: $1,326,329 - $2,022,000
3
Beds
1
Bath
1,178
Sq Ft
$1,420/Sq Ft
Est. Value
About This Home
This home is located at 4268 Orchard Ave, San Diego, CA 92107 and is currently estimated at $1,673,082, approximately $1,420 per square foot. 4268 Orchard Ave is a home located in San Diego County with nearby schools including Silver Gate Elementary School, Richard Henry Dana Middle School, and Correia Middle School.
Ownership History
Date
Name
Owned For
Owner Type
Purchase Details
Closed on
Feb 1, 2021
Sold by
Keck Linda and Linda Green Reck Separate Prop
Bought by
Bauve Monique E La and Linda Green Reck Irrevocable C
Current Estimated Value
Purchase Details
Closed on
Jun 17, 2011
Sold by
Keck Linda
Bought by
Keck Linda and Linda Green Keck Separate Property Trust
Home Financials for this Owner
Home Financials are based on the most recent Mortgage that was taken out on this home.
Original Mortgage
$167,000
Interest Rate
4.46%
Mortgage Type
New Conventional
Purchase Details
Closed on
Jun 15, 2011
Sold by
Keck Tom
Bought by
Keck Linda Green and Linda Green Keck Separate Property Trust
Home Financials for this Owner
Home Financials are based on the most recent Mortgage that was taken out on this home.
Original Mortgage
$167,000
Interest Rate
4.46%
Mortgage Type
New Conventional
Purchase Details
Closed on
Oct 31, 1996
Sold by
Keck Linda Green
Bought by
Keck Linda Green and Linda Green Keck Separate Property Trust
Create a Home Valuation Report for This Property
The Home Valuation Report is an in-depth analysis detailing your home's value as well as a comparison with similar homes in the area
Home Values in the Area
Average Home Value in this Area
Purchase History
| Date | Buyer | Sale Price | Title Company |
|---|---|---|---|
| Bauve Monique E La | -- | Chicago Title Company | |
| Keck Linda | -- | Chicago Title Company | |
| Keck Linda | -- | Chicago Title Company | |
| Keck Linda Green | -- | Chicago Title Company | |
| Keck Linda | -- | Chicago Title Company | |
| Keck Linda Green | -- | -- | |
| Keck Linda Green | -- | -- |
Source: Public Records
Mortgage History
| Date | Status | Borrower | Loan Amount |
|---|---|---|---|
| Previous Owner | Keck Linda | $167,000 | |
| Previous Owner | Keck Linda | $167,000 |
Source: Public Records
Tax History Compared to Growth
Tax History
| Year | Tax Paid | Tax Assessment Tax Assessment Total Assessment is a certain percentage of the fair market value that is determined by local assessors to be the total taxable value of land and additions on the property. | Land | Improvement |
|---|---|---|---|---|
| 2025 | $1,053 | $84,496 | $44,092 | $40,404 |
| 2024 | $1,053 | $82,840 | $43,228 | $39,612 |
| 2023 | $1,029 | $81,217 | $42,381 | $38,836 |
| 2022 | $1,001 | $79,625 | $41,550 | $38,075 |
| 2021 | $995 | $78,065 | $40,736 | $37,329 |
| 2020 | $983 | $77,266 | $40,319 | $36,947 |
| 2019 | $966 | $75,752 | $39,529 | $36,223 |
| 2018 | $905 | $74,267 | $38,754 | $35,513 |
| 2017 | $80 | $72,812 | $37,995 | $34,817 |
| 2016 | $868 | $71,385 | $37,250 | $34,135 |
| 2015 | $855 | $70,314 | $36,691 | $33,623 |
| 2014 | $843 | $68,938 | $35,973 | $32,965 |
Source: Public Records
Map
Nearby Homes
- 3872 Coronado Ave
- 4705-4711 Point Loma Ave Unit 10 & 11
- 3886 Santa Cruz Ave
- 4435 Del Monte Ave
- 4506 Point Loma Ave
- 1202 Fleetridge Dr
- 4027 Narragansett Ave
- 4569 Coronado Ave
- 3742 Wildwood Rd
- 4386 Niagara Ave
- 4611 Santa Cruz Ave
- 4492 Granger St
- 4515 Tivoli St
- 4581 Adair St
- 4617 Del Monte Ave
- 3710 Milan St
- 3733 La Cresta Dr
- 1220 Concord St
- 4625 Adair St
- 1558 Ebers St
- 4276 Orchard Ave
- 4284 Orchard Ave
- 4252 Orchard Ave
- 4244 Orchard Ave
- 4267 Del Mar Ave
- 4275 Del Mar Ave
- 4259 Del Mar Ave
- 4251 Del Mar Ave
- 1585 Venice St
- 4238 Orchard Ave
- 1560 Venice St
- 4245 Del Mar Ave
- 4265 Orchard Ave
- 4277 Orchard Ave
- 4259 Orchard Ave
- 4285 Orchard Ave
- 4251 Orchard Ave
- 4230 Orchard Ave
- 4235 Del Mar Ave
- 4314 Orchard Ave